
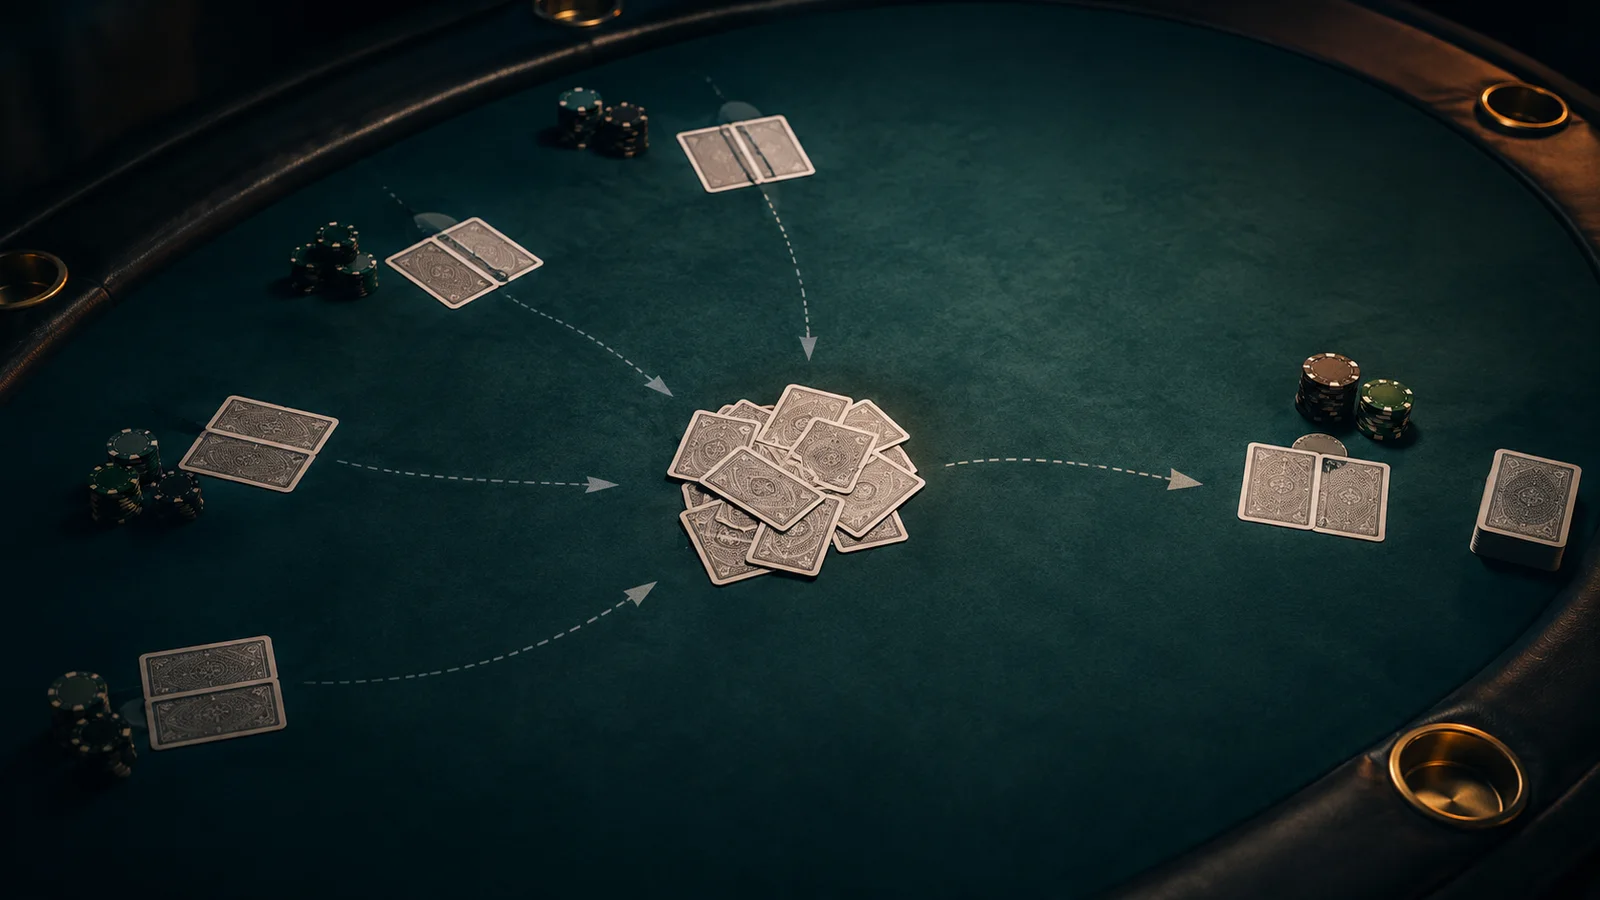
Preflop folds do not physically change the deck. They can change the probabilities you should assign to its unseen cards. That only happens when the chance of folding depends on the private hand: the action then carries partial information about cards you cannot see. Poker players call this conditional card-removal pattern the bunching effect.
One result matters immediately: the number of folds is not enough to determine either the size or the direction of bunching. In our reproducible experiment, five fold policies all had the same 60% average fold likelihood on a fresh deck. A random-fold control caused exactly zero theoretical change. Three policies left aces more likely in the Button's hand after upstream folds. A deliberately inverted policy left aces less likely. Composition—not the headline fold percentage—did the work.
Scope: this is a card-composition experiment with transparent synthetic fold-likelihood policies. It is not a model of real players, a solved GTO range, an exploit, an EV estimate, or a GTO Gecko product output. The 95% intervals quantify Monte Carlo error conditional on each policy; they do not quantify whether that policy resembles poker played in the wild.
What Is the Bunching Effect in Poker?
The bunching effect is the change in your probability distribution over unseen cards after you observe actions that depend on hidden cards. Suppose several players fold before the Button. You do not see their hands, but under a hand-dependent strategy model, a fold need not be equally likely with every starting hand. Compatible complete deals in which those players received fold-heavy hands deserve more weight than deals in which they received continue-heavy hands.
This differs from an ordinary blocker. If you hold A♠, that known card directly removes one ace from every opponent's possible holdings. With bunching, the muck remains hidden. Nothing is removed with certainty; the observed fold history merely reweights compatible possibilities.
Narrow screen? Scroll the table horizontally to compare blockers with bunching.
| Question | Ordinary blocker | Bunching effect |
|---|---|---|
| What is observed? | A specific private or board card | An action, such as a fold; the private cards stay hidden |
| What changes? | Compatible combinations are removed with certainty | Compatible complete deals receive different probabilities |
| What assumption is needed? | Only the known cards and dealing rules | A hand-dependent model for the observed action |
| Can the direction reverse? | The held card fixes what it removes | Yes; reverse the action likelihoods and the posterior can reverse |
Narrow screen? Scroll the diagram horizontally to view all four stages.
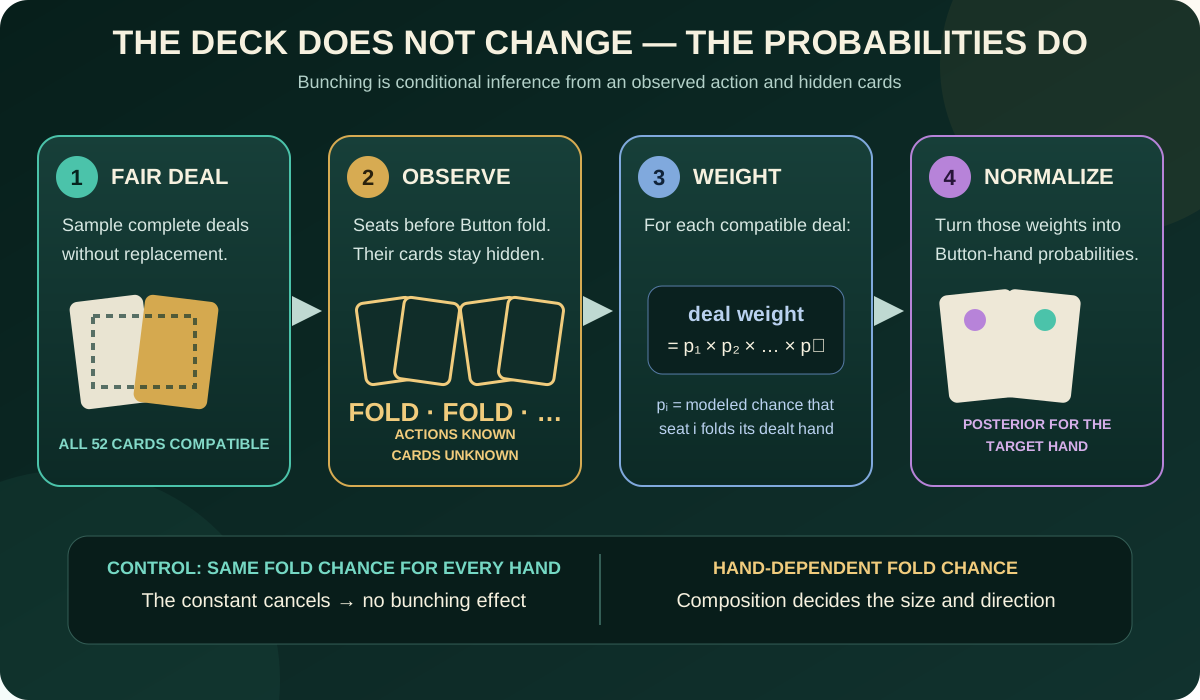
Why a Fold Can Be Information Without Revealing a Card
The logic is ordinary conditional probability. The MIT OpenCourseWare treatment of Bayes' rule formalizes how evidence updates the probability of an event. Here, the evidence is the sequence of folds. The hidden event is a complete allocation of private cards.
The cancellation test
Imagine every legal starting hand folds with probability 60%. After one fold, every compatible deal has been multiplied by the same constant. Normalizing divides by that same constant, so the unseen-card distribution is unchanged.
Now let weak rank combinations fold more often and high-rank combinations continue more often, while keeping the same 60% average. Deals that put low cards in the muck receive more weight. More high cards remain available in the conditional distribution—not because the deck changed, but because the action was more compatible with some hidden deals than others.
That distinction defeats a common shortcut. “Six players folded” cannot by itself imply a top-heavy deck. If those six actions were random with respect to cards, the exact effect is zero. If high-card hands folded more often under an intentionally reversed model, high cards become less likely for the target. A credible bunching result must therefore publish the action model, not just the fold count.
Our Matched-Rate Experiment
We built a standard 52-card Texas Hold'em experiment around a Button target hand. The table labels describe three, five, or six seats folding before the Button—our 6-max, 8-max, and 9-max sensitivity cases. All private cards are dealt before action. Generating upstream hands before the Button in code is exchangeable sampling bookkeeping, not a claim that the physical deal happens after folds.
Each policy assigns a probability of folding to every one of the 1,326 concrete two-card combinations. We then normalized every policy so its physical-combination-weighted mean on a fresh deck was exactly 60%. This holds the one-seat headline rate fixed and isolates what changes when the composition of likely folds changes.
Narrow screen? Scroll the table horizontally to compare all five policies.
| Policy | Purpose | Fresh-deck mean | Expected diagnostic |
|---|---|---|---|
| Random-fold control | Every hand folds with probability 0.60 | 60% | Exactly zero theoretical effect |
| Rank gradient | Fold likelihood declines smoothly as the two ranks rise | 60% | High ranks become more likely after folds |
| Pair + suited gradient | Adds pair and suited terms to a smooth rank score | 60% | A different positive composition shift |
| Bucketed top band | Uses low, middle, and high fold-likelihood bands | 60% | A deliberately coarse positive illustration |
| Inverted rank diagnostic | Makes higher-rank hands more likely to fold | 60% | The high-card shift should reverse |
The exact formulas and normalization factors are in the method README; the fold-likelihood table publishes all 169 final class values. Pair, suited, and offsuit classes represent 6, 4, and 12 concrete combinations respectively. Expanding them matters because cards are sampled without replacement. Independently drawing seats from 169-cell percentages could assign the same physical card twice and erase cross-seat blockers.
For every complete legal deal, the model multiplies the fold likelihoods of all upstream private hands. The primary simulator accepts or rejects that complete deal using the resulting product. This samples the joint condition that all observed seats folded. Fold actions are conditionally independent given private hands in this model; shared cards are the only modeled dependence.
Result: Equal Fold Rates Did Not Produce Equal Decks
The exact unconditional chance that a two-card Button hand contains at least one ace is 1 − C(48,2) / C(52,2) = 14.9321%. The primary run used 200,000 accepted complete deals for each of 15 policy/table scenarios.
Narrow screen? Scroll the table horizontally to compare all three fold counts.
| Synthetic policy | 6-max / 3 folds | 8-max / 5 folds | 9-max / 6 folds |
|---|---|---|---|
| Random control | 14.986% (+0.054) | 14.968% (+0.035) | 15.012% (+0.080) |
| Rank gradient | 15.378% (+0.446) | 15.766% (+0.834) | 16.036% (+1.104) |
| Pair + suited gradient | 15.642% (+0.709) | 16.409% (+1.476) | 16.653% (+1.721) |
| Bucketed top band | 16.121% (+1.188) | 16.972% (+2.040) | 17.454% (+2.521) |
| Inverted diagnostic | 14.385% (−0.547) | 14.152% (−0.781) | 13.952% (−0.980) |
The small positive control estimates are simulation noise, not an effect: each control interval contains the 14.9321% baseline, and the constant policy is exactly neutral by construction. At 9-max, the bucketed model estimated 17.454% with a 95% Wilson interval of 17.288%–17.620%. The inverted diagnostic estimated 13.952% with an interval of 13.801%–14.105%. Those non-overlapping directions show why “folds leave good cards behind” is not a universal rule.
Narrow screen? Scroll the chart horizontally to compare every model.
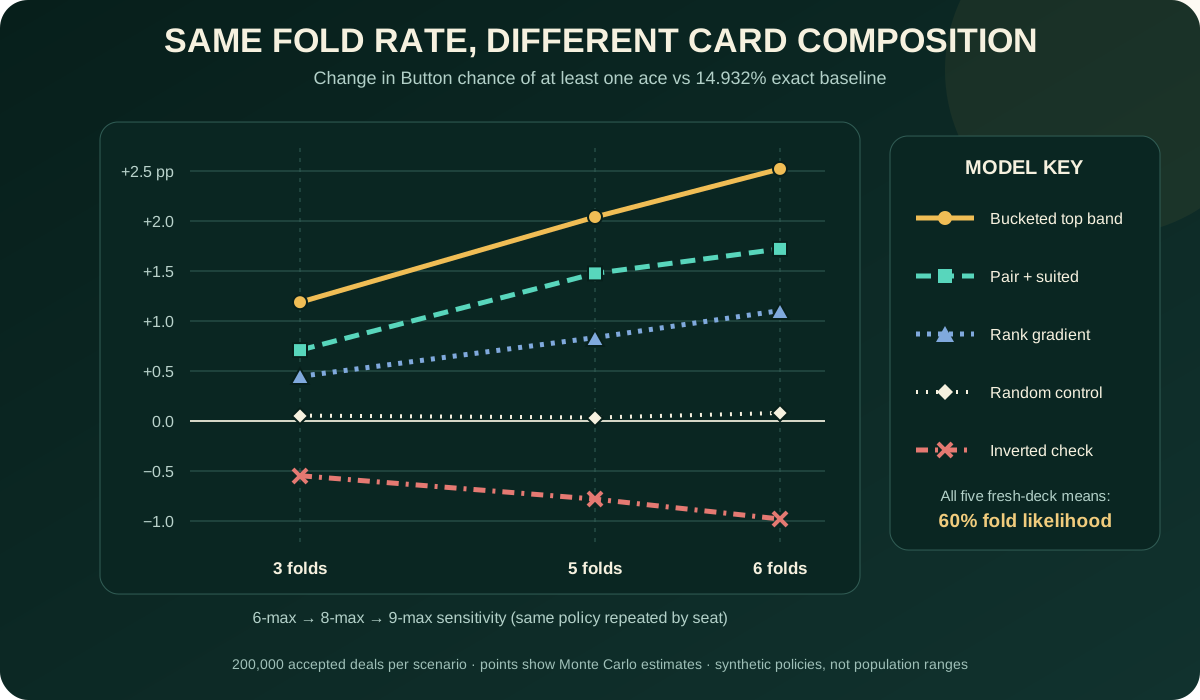
How Large Is a 2.521-Point Shift?
A percentage-point difference is easiest to read as a long-run frequency under the stated model. The bucketed 9-max estimate differs from baseline by 0.02521, which is about one additional ace-containing Button hand per 40 repeated target deals. At three folds, its 0.01188 difference translates to about one per 84 target deals. These are absolute-frequency translations—not waiting-time predictions, session forecasts, or recommendations to enter a pot.
Nor is there one universal “strong hand” multiplier. At 9-max, the pair + suited policy moved the chance that both Button cards were ten or higher from the exact 14.329% baseline to 16.487%, a +2.158-point change. Its any pocket pair point estimate was nearly unchanged at 5.875% versus the 5.882% baseline, and its 95% interval included that baseline. Rank composition, pairing, suitedness, and card compatibility respond differently to the same folded-hand policy.
Narrow screen? Scroll the table horizontally to compare the secondary outcomes.
| Synthetic policy | Both cards T+ | AK | Any pocket pair |
|---|---|---|---|
| Random control | 14.327% (−0.002) | 1.212% (+0.005) | 5.858% (−0.025) |
| Rank gradient | 15.741% (+1.412) | 1.370% (+0.163) | 5.871% (−0.012) |
| Pair + suited gradient | 16.487% (+2.158) | 1.471% (+0.264) | 5.875% (−0.007) |
| Bucketed top band | 15.484% (+1.155) | 1.421% (+0.214) | 5.931% (+0.049) |
| Inverted diagnostic | 13.010% (−1.319) | 1.078% (−0.129) | 5.983% (+0.101) |
The predeclared TT+ result, all 95% intervals, and exact baselines are in the headline-results CSV. The table above shows why a single ace statistic cannot stand in for the complete posterior.
The complete 15 × 169 Button-hand table publishes every class with its Wilson interval. Treat individual small cells cautiously: aggregate events contain many more successes, while rare class estimates have much larger relative Monte Carlo error. The table exists for audit and exploration, not to crown a new opening hand because one simulated cell moved.
Why Table Size Is a Sensitivity Test, Not a Forecast
Our labels map 6-max to three folds before the Button, 8-max to five, and 9-max to six. We deliberately repeated the same fold-likelihood policy at every upstream seat. That isolates what happens as more conditionally informative folds accumulate. It does not say that under-the-gun, hijack, cutoff, and blind ranges are identical in real games.
Actual action probabilities depend on position, prior actions, stack depth, raise size, antes, rake, format, and the strategic model. A real solver tree must carry those position-specific ranges and blockers through the deal. The article's table-size line therefore answers a controlled “what if we add more observations of the same kind?” question. It does not estimate the Button's live-dealt ace frequency at every six-, eight-, or nine-handed table.
How We Checked the Simulation
The main program uses whole-deal acceptance–rejection sampling, a method with roots in John von Neumann's work on random digits and the broader Monte Carlo method described by Metropolis and Ulam. It used NumPy PCG64DXSM, a frozen seed, and 200,000 accepted deals per scenario. Binary results use 95% Wilson intervals. A seed makes a run repeatable; it does not prove the model or code correct.
We added three separate checks:
- Exact one-fold oracle. We enumerated all 1,326 possible folded hands and all 1,225 remaining Button hands for each one. The checker independently reproduced the oracle to a maximum absolute discrepancy below
9.8 × 10⁻¹⁶. - Exact one-fold random control. Inside the independently recomputed one-fold oracle, the constant policy matched the no-information combinatorial baselines below
4.5 × 10⁻¹⁵. The multi-fold control remains a sampled estimate whose intervals contain those baselines. - Different stochastic estimator. A separate program reads the CSV rather than importing the simulator, uses NumPy Philox and a different deal generator, and estimates the conditional result with self-normalized importance sampling. Across 15 scenarios, five headline metrics, all 169 hand classes, and 13 rank shares—2,805 comparisons—the largest primary/checker gap was 4.033 combined Monte Carlo standard errors, below our five-standard-error implementation-alarm threshold.
That threshold is deliberately broad because thousands of comparisons create extreme values. Passing it is evidence against a coding mismatch between the two implementations; it is not a statistical equivalence claim, peer review, or validation of the synthetic policies.
Reproduce or Audit Every Number
The evidence bundle freezes code, inputs, seeds, outputs, readable summaries, and a checksum manifest:
- Method and reproduction guide
- Full primary results (JSON) and headline results (CSV)
- All 169 Button classes (CSV) and all fold likelihoods (CSV)
- Exact one-fold oracle (JSON)
- Primary simulator and independent checker
- Checker summary, full checker output, and SHA-256 manifest
Python 3.11 and NumPy 2.2.3 produced the frozen run. Re-running 15 acceptance/rejection scenarios can take substantial time because some conditional deals have low acceptance probability. The README provides the exact commands and explains every output field.
What This Result Does Not Tell You
- It does not reveal a mucked hand. Bunching changes a distribution; it does not identify any player's cards.
- It does not estimate a population. None of the four non-control policies was fitted to hand histories, a player pool, or a solver.
- It does not supply an action. Card composition alone cannot establish a raise, call, or fold frequency, exploitability, or EV.
- It does not transfer across trees. Change positions, stacks, sizes, prior actions, rake, antes, or strategy assumptions and the fold likelihoods change.
- It does not prove a product feature. This experiment does not test whether any particular solver or training app accounts for bunching.
HoldemResources Calculator has published a useful earlier visual and implementation-oriented treatment of card bunching. We designed this experiment around a different question: whether equal average fold likelihoods can still produce zero, positive, and reversed shifts. The answer under our declared policies is yes.
How to Use the Idea in Study
First identify the information boundary. Known hole cards and board cards are direct removal. Hidden folds require an explicit range or action-likelihood model. Then ask whether the tool or reference you are using carries folded ranges through the node. Do not “correct” a chart by adding a generic full-ring percentage from this article; the correction belongs to the specific tree and its ranges.
Disclosure: GTO Solutions AS publishes both this site and GTO Gecko. Once the assumptions are locked, use a comparable available precomputed spot in GTO Gecko to inspect actions, frequencies, EV estimates, and range composition, then practise supported decisions. The current US App Store and Google Play listings describe that solved-scenario study workflow; they do not establish that the app implements the bunching model in this article.
Frequently Asked Questions
- Do folded cards make the deck stronger?
- Not as a universal rule. Under a model that folds low ranks more often, observed folds can shift probability toward higher unseen ranks. Random folds cause no effect, and a model that folds high ranks more often reverses the direction.
- Is bunching the same as card removal?
- It is a conditional form of card removal. A known blocker removes specific combinations with certainty; bunching reweights unseen combinations using the likelihood of observed actions.
- Does the bunching effect matter more at a full table?
- More informative folds can compound the shift under one fixed policy, as our sensitivity test shows. Real table-size comparisons also change positions, ranges, stacks, and action histories, so the chart is not a universal full-ring forecast.
- Can I calculate bunching from a fold percentage?
- No. You need the card-by-card composition of the fold likelihoods and a without-replacement joint deal model. Policies with the same average fold likelihood produced different and opposite results here.
- Do poker solvers account for bunching?
- Some solver documentation explicitly describes folded-card removal, but behavior varies by product and mode. Check the documentation for the exact tree you use rather than assuming every output includes—or excludes—it.
The Practical Takeaway
A preflop fold can be evidence about unseen cards, but only through a declared model of which hands would fold. Count the actions, preserve card compatibility, publish the range composition, and keep model uncertainty separate from simulation precision. If one number survives this experiment, make it zero: with a card-independent fold policy, the exact bunching effect is zero.
Sources
- MIT OpenCourseWare: Conditional Probability, Bayes' Rule and Independence
- NIST/SEMATECH e-Handbook glossary: hypergeometric sampling without replacement and Wilson confidence intervals
- Metropolis and Ulam (1949): The Monte Carlo Method
- von Neumann: Various Techniques Used in Connection With Random Digits
- Wilson (1927): Probable Inference, the Law of Succession, and Statistical Inference
- HoldemResources Calculator: Visualizing the bunching effect (current product article checked September 4, 2026)
- GTO Gecko experiment method, data dictionary, reproduction commands, and limitations
- GTO Gecko on the US App Store and Google Play (checked September 4, 2026)