
For an eligible hand under a 5% schedule capped at $0.75, the continuous breakpoint is a $15 gross pot. Above that point, the modeled rake cannot exceed $0.75, so its effective share becomes $0.75 divided by the pot: 3.75% on $20, 2.50% on $30, and 1.50% on $50. Whole-cent half-even rounding creates a narrow boundary around $15, however, so this guide names three different thresholds instead of saying only that “the cap kicks in at $15.”
The worked fixture is the standard US-dollar No Limit/Pot Limit $0.25/$0.50 row published by PokerStars and checked September 4, 2026. On that page, the cap bucket uses players dealt into the hand, and a Hold’em or Omaha hand ending before the flop has no rake. The calculator below is a disclosed nearest-cent, final-gross-pot model of that public schedule—not a reconstruction of an operator’s internal ledger and not a claim about every poker room.
Open the schedule-aware rake-cap worksheet. It is intentionally limited to the 22 PokerStars rows frozen for this article; another room requires its own current documented inputs.
Disclosure: GTO Solutions AS publishes GTO Gecko and this article. The worksheet, chart, implementation, and verification bundle were created for this guide. They are for off-table study and do not recommend a poker action or estimate one player’s profit.
The Short Answer: Percentage, Cap, and Effective Rate
Start with eligibility. Under the cited PokerStars Hold’em/Omaha rule, a hand that ends before the flop returns zero modeled rake. For an eligible hand, define P as the modeled gross rakeable pot, r as the published percentage, and C as the published cap for the correct dealt-player bucket. In the implementation, 500 basis points means 5.00%:
uncapped cents = half_even(P_cents × rate_basis_points / 10,000)
modeled rake = min(C_cents, uncapped cents)
effective rake = modeled rake / gross pot
continuous breakpoint = C / r
cap in big blinds = C / big blind
The percentage describes how rake rises before the cap binds. The cap is a dollar ceiling, not a second percentage. Once modeled rake is fixed at that ceiling, the effective percentage falls as the gross pot grows. The rake dollars do not fall; they stop rising.
One line worth remembering
In the continuous model, effective rake tracks the nominal percentage below a binding cap. Whole-cent rounding creates small steps around that line. Above the cap, effective rake is cap ÷ gross pot. This describes house take under the model, not how that amount is attributed to an individual player.
Read the Correct Schedule Row Before Doing Any Math
A percentage and blind level are not enough. The current official PokerStars rake page, accessed September 4, 2026, publishes three separate US-dollar No Limit/Pot Limit tables: a standard table, a micro-stakes Omaha/Omaha Hi-Lo table, and a micro-stakes No Limit Hold’em Zoom table. Its player-count note says “players” means players dealt into that hand, not seats at the table.
| Input | Published value used | Why it matters |
|---|---|---|
| Stake row | $0.25/$0.50 | Sets the percentage and candidate caps |
| Percentage | 5.00% = 1/20 | Applied to the modeled gross pot before the cap |
| 2 players dealt | $0.75 cap | 1.50bb at a $0.50 big blind |
| 3–4 players dealt | $0.75 cap | Same $0.75 cap as the 2-dealt bucket |
| 5+ players dealt | $2.00 cap | 4.00bb at a $0.50 big blind |
| Eligibility | No rake when the hand ends before the flop | This branch comes before percentage arithmetic |
“USD” identifies the schedule’s currency; it does not establish account access or legal availability in a reader’s location. Another operator’s current published rake and blind structure uses its own categories and caps. That narrow comparison is enough to show why a worksheet must begin with the room’s current rules instead of a remembered default.
Why “The Cap Starts at $15” Hides Three Answers
The exact continuous equation $0.75 ÷ 0.05 = $15 is useful, but a whole-cent display makes “starts” ambiguous. Under this worksheet’s half-even convention, the boundary has three named points:
| Gross pot | Exact raw rake | Uncapped half-even cents | Final modeled rake | Meaning |
|---|---|---|---|---|
| $14.90 | 74.50¢ | 74¢ | 74¢ | Exact tie rounds to even 74 |
| $14.91 | 74.55¢ | 75¢ | 75¢ | First displayed cap value |
| $15.00 | 75.00¢ | 75¢ | 75¢ | Raw percentage reaches the cap |
| $15.10 | 75.50¢ | 76¢ | 75¢ | First pot where the cap changes the rounded result |
- First displayed cap: $14.91, or 29.82bb. Half-even rounding first prints 75¢, although the exact raw amount is still below 75¢.
- First integer-cent pot whose raw percentage reaches the cap: $15.00, or 30bb. This is the familiar
C/rpoint on the available cent grid. - First strictly binding cap: $15.10, or 30.20bb. Uncapped half-even rake would be 76¢, so the cap now changes the result to 75¢.
Parity matters at an exact half cent. At 4.5%, a $1 pot produces exactly 4.5¢ and rounds to the even integer 4¢; a $3 pot produces 13.5¢ and rounds to the even integer 14¢.
Same 5%, Different Effective Rake
The next table holds stake, percentage, rounding, and gross pot fixed. Only the dealt-player cap changes: $0.75 for two dealt versus $2.00 for five or more dealt. These are controlled calculations, not estimates of common pot sizes or one player’s share.
Narrow screen? Scroll horizontally to compare both dealt-player caps.
| Gross pot | Pot in bb | Rake, $0.75 cap | Effective rate, $0.75 cap | Rake, $2 cap | Effective rate, $2 cap |
|---|---|---|---|---|---|
| $5 | 10bb | $0.25 | 5.000% | $0.25 | 5.000% |
| $10 | 20bb | $0.50 | 5.000% | $0.50 | 5.000% |
| $15 | 30bb | $0.75 | 5.000% | $0.75 | 5.000% |
| $20 | 40bb | $0.75 | 3.750% | $1.00 | 5.000% |
| $30 | 60bb | $0.75 | 2.500% | $1.50 | 5.000% |
| $40 | 80bb | $0.75 | 1.875% | $2.00 | 5.000% |
| $50 | 100bb | $0.75 | 1.500% | $2.00 | 4.000% |
Narrow screen? Scroll the chart horizontally to compare both curves through 100bb.
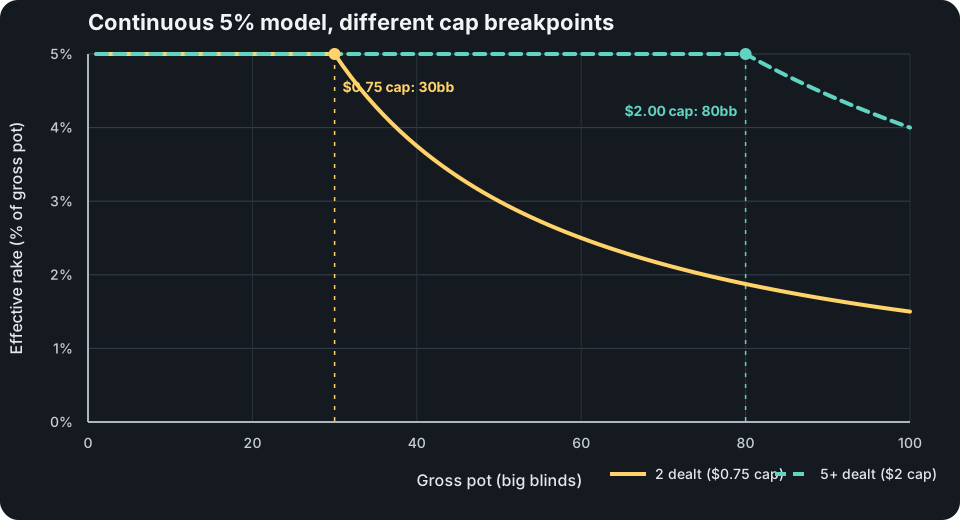
At $15, the two-player result displays the cap but the cap does not yet alter the rounded 75¢ result. At $40, the five-plus-player result behaves the same way at its $2 cap. This distinction does not change the continuous curve, but it prevents a calculator from describing a rounding event as a binding event.
Three Schedule Mistakes the Worksheet Catches
1. Counting seats instead of players dealt
At standard $0.10/$0.25, a $30 eligible pot produces $1.35 of raw rake at 4.5%. The modeled result is $0.50 with two players dealt, $1.00 with three or four dealt, and $1.35 with five or more dealt. A six-seat table with four players dealt uses the 3–4 bucket under the cited definition; empty seats do not move it to 5+.
2. Selecting a row from blinds alone
At $0.05/$0.10, a $10 eligible postflop pot with two dealt has three different results in the dated snapshot:
- Standard US-dollar NL/PL: 5%, $1 cap, modeled rake $0.50.
- Micro Omaha/Omaha Hi-Lo: 4.25%, $0.50 cap, modeled rake $0.42 because the exact 42.5¢ tie rounds to even 42.
- Micro NLHE Zoom: 4.5%, $0.50 cap, modeled rake $0.45.
The worksheet makes the schedule family an explicit selection and accepts only stake labels in that family. It does not infer “micro” from the blind size or fall back to a generic percentage.
3. Assuming caps must rise with player count
The current standard $25/$50 row prints caps of $2.25 for two dealt, $2.00 for three or four, and $3.00 for five or more. The checked-in snapshot preserves that non-monotone row exactly. A tidy-looking correction would be a source error, not data cleaning.
Apply the Method to Your Room Rules
- Confirm the source. Record the venue, currency, game family, exact stake row, and access date.
- Check eligibility first. Apply the room’s documented no-flop/no-drop or other eligibility rule before calculating a percentage.
- Use the source’s player definition. It may refer to players dealt, seats, players seeing a street, or something else.
- Apply the published arithmetic. Use the percentage, precision, and rounding rule the source actually documents; label assumptions where it does not.
- Apply the cap. Keep “cap displayed” separate from “cap strictly changed the result” near a rounding boundary.
- Normalize after the cash result. Divide cap and breakpoint by the big blind only when one exact blind level belongs to the selected row.
- Reconcile before reuse. Compare the result with current documentation or a completed-hand record; do not carry a dated row forward silently.
The offline-capable rake-cap worksheet embeds only the dated PokerStars snapshot used here. It routes those 22 source rows and 66 dealt-player combinations explicitly, distinguishes all three thresholds, and makes the first-betting-round branch visible. It makes no external requests and is intended for review away from active play. To use the method for another room, begin from that room’s own current documentation rather than altering a frozen source row.
What This Model Does Not Tell You
The public schedule names true-percentage half-even rounding, but it does not separately document the smallest accounting unit or whether an internal system calculates once from a final gross pot or incrementally as a pot grows. This article therefore applies the named rule once to one integer-cent gross-pot input and says so. It does not claim exact client behavior at half-cent ties, uncalled bets, side pots, split pots, multiple boards, returned or cancelled hands, or disconnections.
The model also excludes contributed-rake attribution, rewards, rakeback, promotions, jackpot drops, time collections, fixed-limit schedules, tournament fees, and taxes. House rake is not automatically one player’s cost. A cap crossing alone does not show that a call, raise, or fold is correct, nor does it produce a range, frequency, exploit, or win-rate estimate.
For a decision after money has already entered the pot, our pot-odds guide owns the separate call-price and equity arithmetic. A full strategic comparison still needs positions, stacks, ranges, legal sizes, and a specified game tree.
Match the Assumptions Before Studying a Solution
Once the accounting is clear, use the same discipline with training material: check that the game, depth, positions, and rake assumptions match the spot you intend to study. Our separate guide to how GTO Gecko solution assumptions are organized owns that workflow.
GTO Gecko’s current US App Store page, checked September 4, 2026, describes an off-table study app for available precomputed scenarios, with actions, mixed frequencies, EV estimates, range composition, explanations, simulated practice, and progress tracking. This article’s worksheet is not an in-app rake calculator, does not create a new solve for an arbitrary schedule, and does not connect to a live poker client.
Poker Rake-Cap FAQ
What does “5% capped at $0.75” mean?
For an eligible pot, calculate 5% under the stated precision and rounding rule, then limit the rake to $0.75. In a continuous model, the two are equal at a $15 gross pot. Above it, $0.75 is a declining percentage of the growing pot.
At what pot does a rake cap start to apply?
Name the event. In the 5%/$0.75 nearest-cent example, the first displayed cap is $14.91, raw percentage reaches the cap at $15.00, and the cap first changes the rounded result at $15.10. Saying only “$15” hides the display and binding boundaries.
Does player count mean seats or players seeing the flop?
Neither is safe to assume. The cited PokerStars table defines it as players dealt into that particular hand. Read the definition on the schedule you use.
Does no flop, no drop apply at every poker room?
No universal claim is made here. It is the eligibility rule printed for the cited PokerStars Hold’em/Omaha schedule. Check the current rules for your venue, game, and table.
Does the rake amount fall after the cap?
Not in this percentage-plus-cap model. The rake amount stops rising at the cap while its effective percentage falls because the pot denominator keeps growing.
Does reaching the cap change the correct poker strategy?
The cap changes one model input, not an action by itself. Direction and size depend on the full spot and require comparable solved or otherwise justified game trees.
Can I reuse this schedule later?
Only after checking it again. The snapshot records what the official page showed on September 4, 2026. Rates, caps, table families, rules, and URLs can change.
Method, Independent Check, and Downloads
The public JavaScript generator stores the source rates as basis points and performs half-even rounding with BigInt quotient/remainder arithmetic. Binary floating-point can move an exact half-cent tie to the wrong side, so a separately written Python standard-library verifier recomputes the outputs without importing the JavaScript. It checks all 22 source rows and 66 family/stake/player combinations, 14 fixtures covering both half-even parity outcomes for every published rate, all three breakpoint formulas, no-flop/no-drop, CSV/JSON agreement, offline calculator controls, and every whole-cent pot from $0 through $2,000. SHA-256 hashes cover the 11 listed artifacts.
Passing those checks proves internal consistency with the frozen snapshot. It does not prove that the live schedule remains unchanged or that the disclosed accounting assumptions reproduce an undocumented production ledger.
- Interactive schedule-aware rake-cap worksheet
- Method, data dictionary, reproduction commands, and limitations
- Dated 22-row source snapshot and 66 normalized schedule/player rows
- Article worked cases and complete reference output
- JavaScript generator, independent Python verifier, verification specification, and SHA-256 manifest
Sources
- PokerStars, Poker Table Rake. Used for the three US-dollar No Limit/Pot Limit schedule families, rates, caps, exclusions, dealt-player definition, no-flop/no-drop rule, and half-even statement; accessed September 4, 2026.
- PokerStars Help, What is rake in poker?. Used for the first-party plain-language description of percentage rake, caps, and no-flop/no-drop; accessed September 4, 2026.
- partypoker, Rake and blind structure. Used only to establish that another operator publishes a differently structured schedule; accessed September 4, 2026.
- GTO Gecko, public method, frozen source snapshot, reproduction commands, and limitations, generated and independently checked September 4–5, 2026.
- GTO Gecko, official US App Store listing. Used only for the disclosed current product description; accessed September 4, 2026.
This independent educational worksheet is not affiliated with or endorsed by PokerStars or partypoker.