
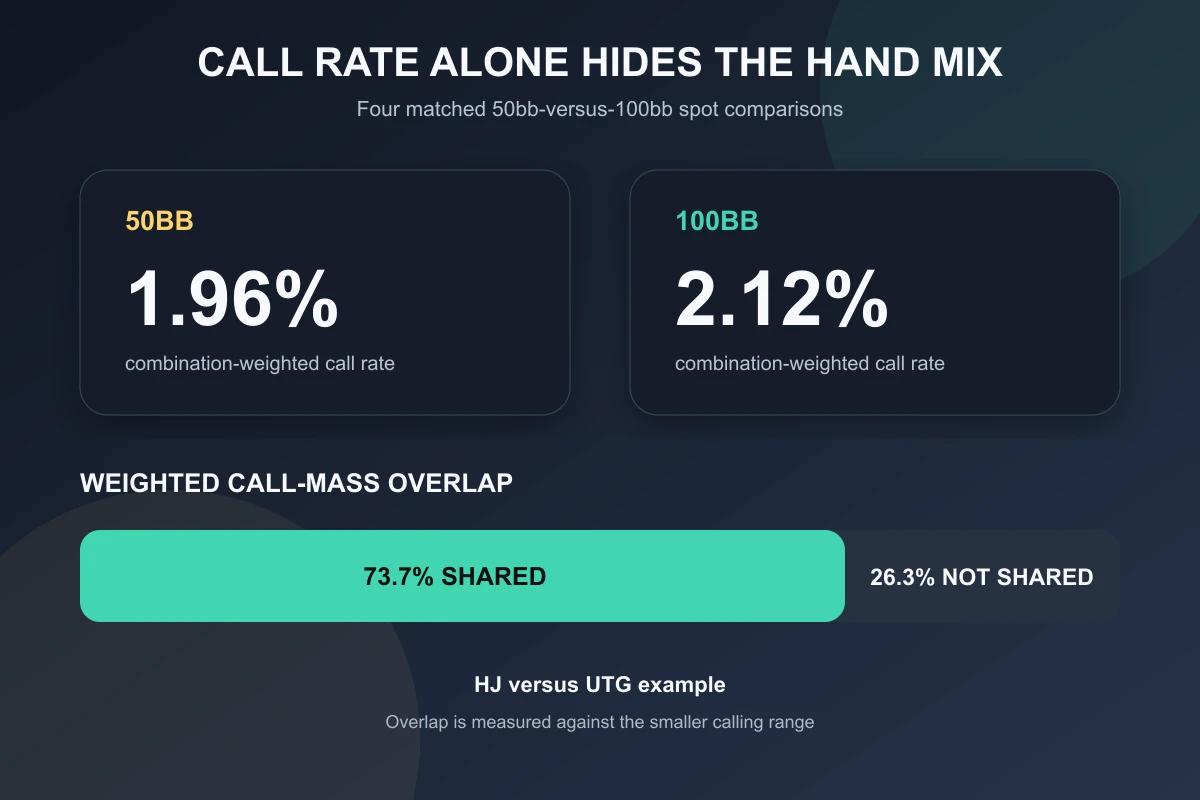
Across four matched 6-max cash spots, the absolute change in cold-call rate from 50bb to 100bb ranges from 0.16 to 0.82 percentage points. Those changes are not necessarily small relative to the low starting rates: button versus under the gun rises by 26.1%. The composition shift is clearer still. Only 70.6% to 75.3% of the smaller calling range's weighted call mass is shared at the other depth, leaving 24.7% to 29.4% not shared.
The useful lesson is that one aggregate percentage can hide a material change in the hands producing it. This article reports every planned comparison, including the one where the 100bb call rate falls. It is a point-in-time study of four specific model comparisons—not a universal cold-calling chart. Disclosure: this article is published by the team behind GTO Gecko.
What We Compared
For this study, a cold call means a non-blind player's call of the first open raise. Small-blind and big-blind responses are excluded because those seats have already posted chips. This is the study's operational definition; poker usage is not perfectly uniform.
The positions are under the gun (UTG), hijack (HJ), cutoff (CO), and button (BTN). The fixed setup was a 6-max regular no-limit Hold’em cash game with equal 50bb or 100bb stacks, no ante or straddle, 5% rake capped at 4bb, an open to 2.5bb, and response options of fold, call, raise to 7.5bb, or all-in. Each aggregate is weighted across all 1,326 physical starting-hand combinations.
We selected the full non-blind responder chain against an UTG open—HJ responds; HJ folds and CO responds; HJ and CO fold and BTN responds—plus BTN versus a CO open after UTG and HJ fold as a late-position contrast. The set is deliberately nonexhaustive. Each matched pair preserves the opener, responder, folded seats, and players still to act while changing only stack depth. Four pairs therefore represent eight decision nodes.
Four Matched Spots: Call Rate and Composition
Narrow screen? Scroll the chart horizontally to compare both depths and all four overlap values.
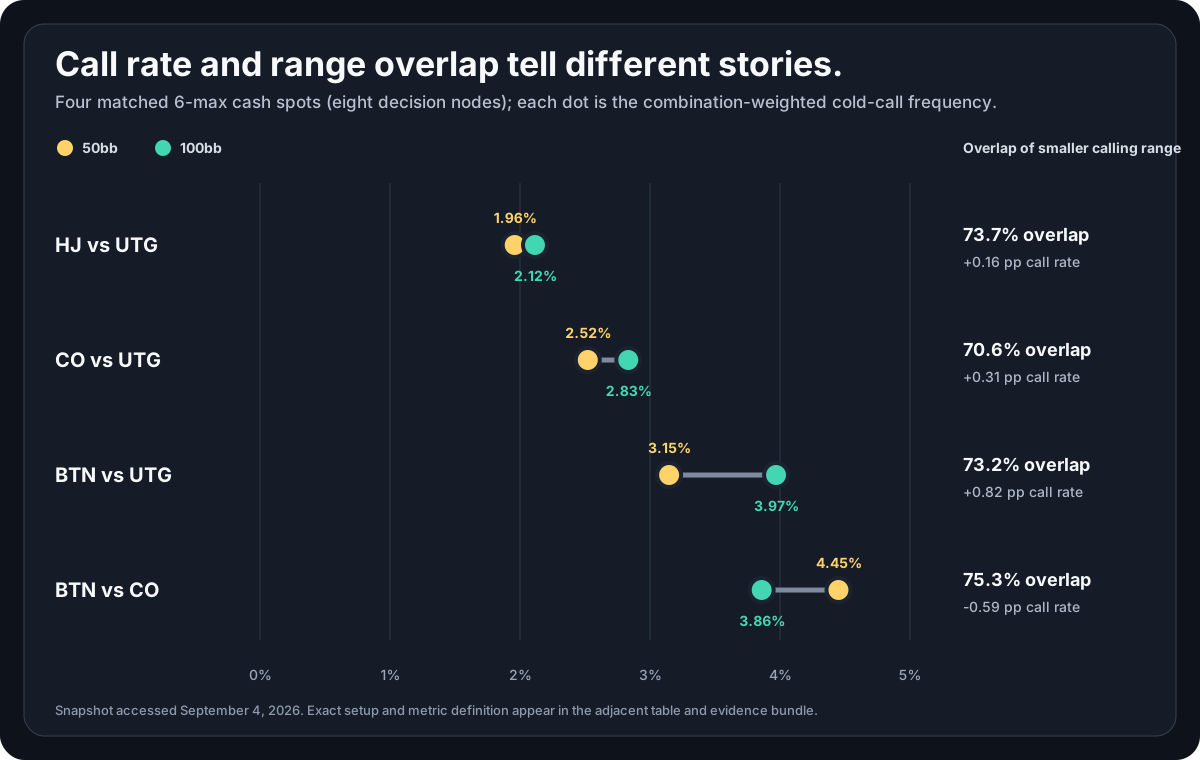
Narrow screen? Scroll the table horizontally to inspect every rate and composition value.
| Response spot | Call at 50bb | Call at 100bb | Absolute change | Relative change | Shared mass | Not shared |
|---|---|---|---|---|---|---|
| HJ vs UTG | 1.96% | 2.12% | +0.16 pp | +8.0% | 73.7% | 26.3% |
| CO vs UTG | 2.52% | 2.83% | +0.31 pp | +12.3% | 70.6% | 29.4% |
| BTN vs UTG | 3.15% | 3.97% | +0.82 pp | +26.1% | 73.2% | 26.8% |
| BTN vs CO | 4.45% | 3.86% | −0.59 pp | −13.3% | 75.3% | 24.7% |
Three 100bb call rates are higher, but BTN versus CO is lower. The snapshot therefore does not support “deeper means call more” as a general rule. HJ versus UTG illustrates why percentage points and composition should be read together: its rate rises only 0.16 points, while 26.3% of the smaller range's weighted call mass is not shared at the other depth.
This composition question is narrower than the one answered in our multiway pots strategy guide, which covers how often cold calls occur with players behind and what changes after the flop.
What the Overlap Metric Measures
A raw rate treats any two 3% calling ranges as equivalent. The overlap calculation keeps the hand labels and physical combination weights attached:
- For each of the 169 starting-hand classes, convert its call frequency to physical call mass.
- Use six combinations for a pair, four for a suited non-pair, and twelve for an offsuit non-pair.
- At each class, take the lower call mass at 50bb and 100bb.
- Add those shared pieces and divide by the smaller depth's total call mass.
A 75% result means 75% of the smaller range's weighted call mass is also present at the other depth. It does not mean 75% of the 169 hand labels are identical. Mixed frequencies and combination counts both matter. Non-overlap is simply 100% minus overlap, using the same denominator.
How to Study Stack-Depth Changes
- Match the configuration. Positions, folded seats, rake, cap, sizing, antes, and players still to act are part of the spot.
- Read absolute and relative changes together. A sub-one-point move can still be large when the starting action is rare.
- Compare the full action mix. The public summary includes aggregate fold, call, raise, and all-in frequencies. If call mass falls, check where aggregate mass moved before drawing a conclusion.
- Use overlap as a composition alarm. A close absolute total width does not establish that the same hands take the action.
- Drill matched contrasts. Alternate the 50bb and 100bb versions and predict the direction before revealing the aggregate answer.
A baseline can organize practice, but these model outputs do not describe how a specific player pool behaves. Keep model study and exploit adjustments separate.
Method, Independent Check, and Downloads
The reporting plan fixed the setup, three then-unseen comparisons, the joint four-spot set, weighting, overlap definition, and report-every-row rule before the new extraction. HJ versus UTG had already been used as a feasibility check, so that result was known. The sanitized registration states this boundary rather than presenting the exercise as fully blind.
The first implementation decoded the retained snapshot and checked a full 1,326-combination response range at each of eight decision nodes. A separately written Python implementation then re-fetched the source. It completed 1,384 structural and invariant validations and 64 numerical comparisons; every numerical comparison passed at a tolerance of 1e-12. Agreement shows that two implementations reproduce the declared calculations. It is not peer review or proof that the model applies universally.
Inspect the sanitized public evidence:
- Method, disclosure, and interpretation limits
- Aggregate summary (JSON)
- Four matched comparisons (CSV)
- Sanitized reporting plan
The full hand-level matrices, internal identifiers, storage locations, hashes, and EV arrays remain private. The public bundle lets readers inspect the method and reconcile the published aggregate outputs across formats. It does not contain the hand-level inputs required to recompute overlap independently; authorized internal reviewers reproduced that calculation against the retained source.
Where GTO Gecko Fits
The current US App Store listing and Google Play listing, checked September 4, 2026, describe GTO Gecko as educational poker study software for reviewing available precomputed ranges, mixed action frequencies, actions, EV estimates, and range composition. You can use it to compare available matched spots and practice simulated decisions.
The four comparisons here come from selected precomputed library spots. They are not custom solves made for this article, and the listings do not establish that every possible cold-call formation is available. Product details and the selected snapshot were checked on the publication date; no app binary was installed or tested for this article.
Limits of This Study
- Four selected comparisons cannot establish a universal direction for stack-depth effects.
- The snapshot is a model comparison, not a sample of human hands or player-pool behavior.
- The results do not transfer automatically to another rake, size, seat order, table format, stack, or action history.
- The study observes allocation changes; it does not isolate why individual hands change or measure their future postflop value.
- The aggregate results are a contrast drill, not a complete range to copy.
Sources
- GTO Gecko selected precomputed 6-max cash-library snapshot, accessed September 4, 2026; sanitized aggregate summary, method notes, and reporting plan.
- Apple App Store — GTO Gecko: Poker Study, accessed September 4, 2026.
- Google Play — GTO Gecko: Poker Study, accessed September 4, 2026.