
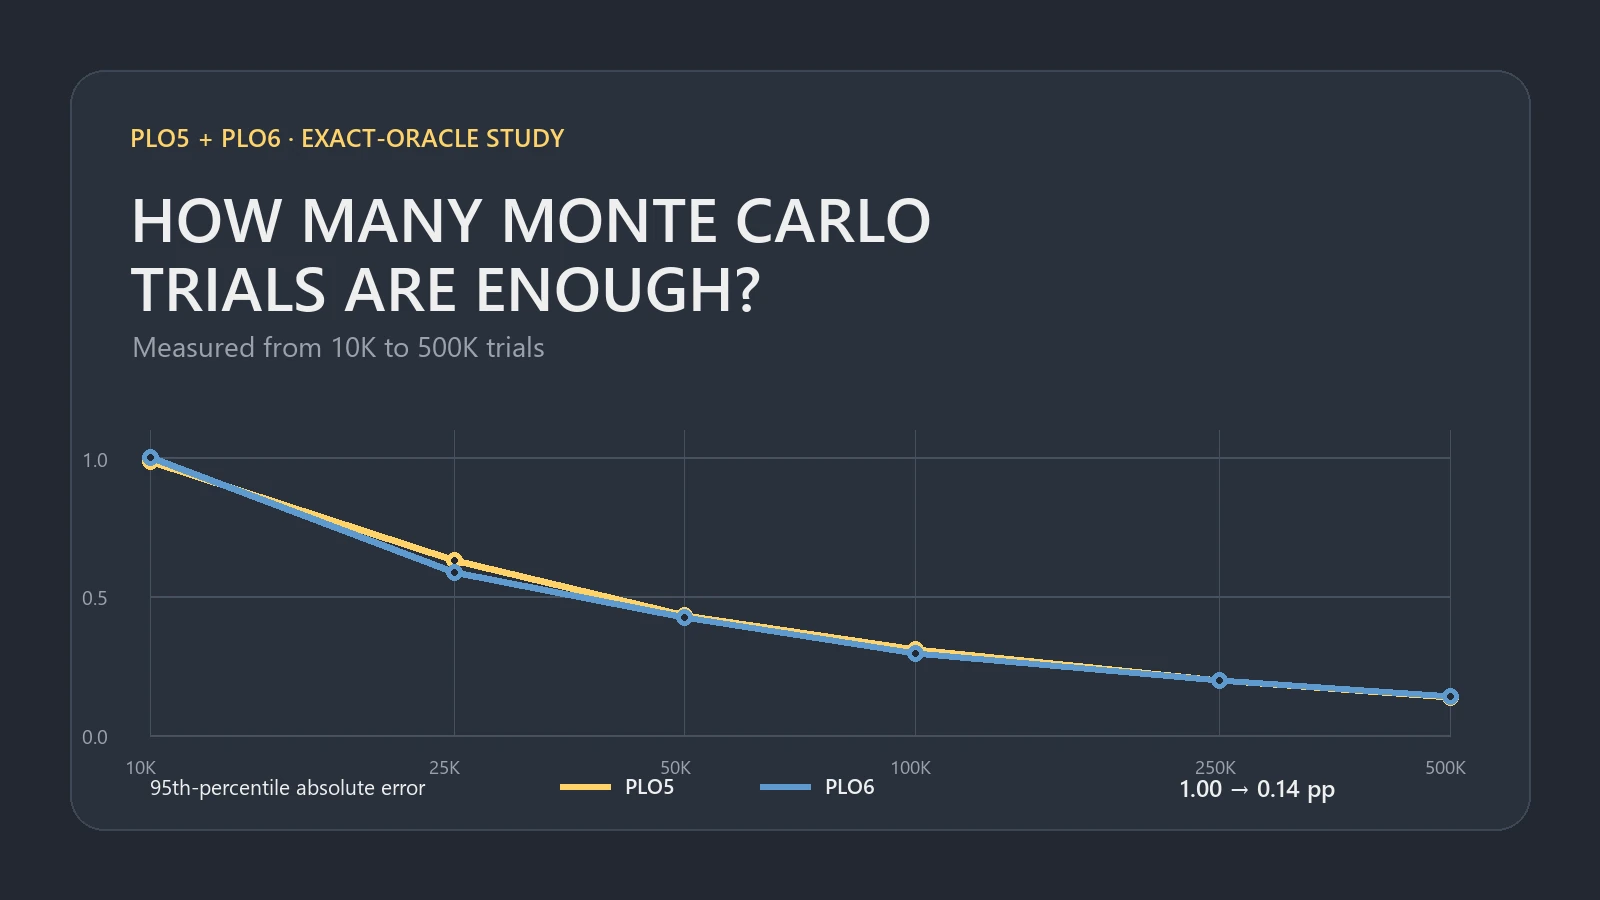
In our six fixed-hand preflop tests, the widest 95th-percentile error for one estimate was about 1.00 percentage point at 10,000 Monte Carlo trials, 0.43 at 50,000, 0.31 at 100,000 and 0.14 at 500,000. PLO5 and PLO6 followed almost the same curve. When comparing two independently sampled estimates, uncertainty from both contributes, so this one-estimate error ladder is not a 95% cutoff for their difference. Rerun close comparisons, increase the trial count or use exact enumeration when it is practical.
We obtained ground truth by evaluating every legal final board for three PLO5 matchups and three PLO6 matchups. We then generated 2,000 seeded estimates for every spot at each of six trial counts: 72,000 estimates in total. The hands, seeds, code and outputs are downloadable below.
Disclosure: GTO Gecko publishes this article. OmahaCalc, discussed below, is also a GTO Solutions AS product. This study was generated separately for the article; it is not a benchmark of OmahaCalc or any other app. The examples are constructed study inputs, not observed hands or strategy recommendations.
Practical reading of this test panel
- 10,000 trials: useful for a quick estimate, but a one-point gap can still be sampling noise in a near-even spot.
- 50,000 trials: the widest measured 95th-percentile error fell below 0.45 points.
- 100,000 trials: the corresponding error was about 0.3 points.
- 500,000 trials: it reached about 0.14 points, at 50 times the trial count of 10,000 trials.
These are measurements from six disclosed spots, not universal guarantees. Range, multiway and unusual tie structures can behave differently.
Measured Error From 10,000 to 500,000 Trials
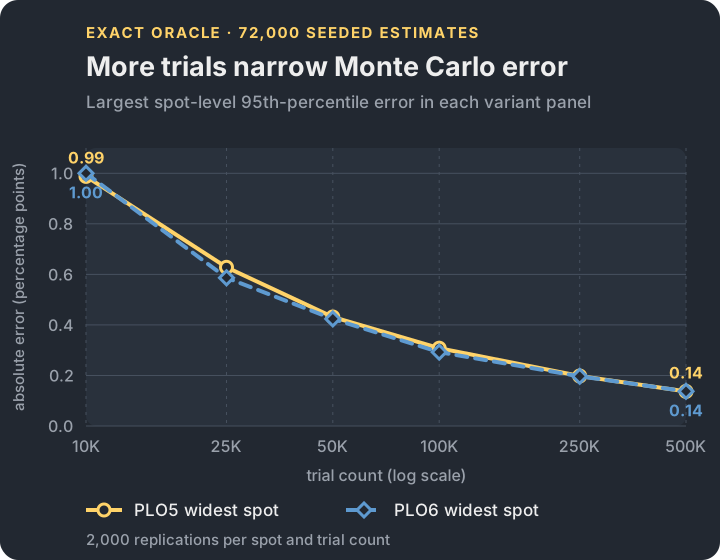
For each spot and trial count, we sorted the absolute difference between the Monte Carlo estimate and exact equity. The 95th percentile is a useful study benchmark: approximately 95% of that spot's seeded estimates were at or below that error. The chart shows the largest such value among the three spots in each variant.
On a narrow screen, scroll the table horizontally.
| Trials | PLO5 error | PLO6 error | What changed from 10K |
|---|---|---|---|
| 10,000 | 0.99 pp | 1.00 pp | Baseline |
| 25,000 | 0.63 pp | 0.59 pp | About 1.6–1.7× narrower |
| 50,000 | 0.43 pp | 0.42 pp | About 2.3× narrower |
| 100,000 | 0.31 pp | 0.29 pp | About 3.3× narrower |
| 250,000 | 0.20 pp | 0.20 pp | About 5× narrower |
| 500,000 | 0.14 pp | 0.14 pp | About 7× narrower |
The pooled median error was much smaller: 0.287 points at 10,000 trials, 0.090 at 100,000 and 0.041 at 500,000. We lead with the wider per-spot 95th percentile because the median describes an ordinary run, not the less convenient run that makes the displayed equity jump.
How to Choose a Trial Count Without Overreading the Result
Start with the precision you need for one fixed-hand estimate. At 100,000 trials, a displayed 55.2% could still be a few tenths from exact equity in the widest spots in this panel. If two independent runs show 55.2% and 55.4%, both estimates carry sampling uncertainty; the 0.2-point gap is not resolved merely because either run used 100,000 trials.
- Use 10,000 trials to orient yourself. In this panel, it put 95% of individual estimates within about one percentage point even in the widest near-even spots.
- Use 50,000 to 100,000 for tighter single-estimate precision. The measured 95th-percentile error for one estimate was about 0.42–0.43 points at 50,000 and 0.29–0.31 at 100,000.
- Use 250,000 to 500,000 when a few tenths matter. The one-estimate error narrowed to about 0.20 and 0.14 points respectively, but it did not disappear. Comparing two sampled outputs still requires accounting for both.
- Prefer exact enumeration for a tractable fixed-hand spot. A deterministic answer is better than spending more samples to approximate a state space you can enumerate.
Do not turn those steps into a universal preset. A simulator that samples opponent ranges, dead cards, multiple players or two boards has a different model. Also keep raw equity separate from expected value: a more precise showdown percentage does not add position, stack depth, future betting, rake or opponent actions. Our poker equity explainer covers that distinction.
Why Four Times the Trials Only Halves the Error
A Monte Carlo equity estimate is an average. Give a win a score of 1, a tie 0.5 and a loss 0. The estimate is the mean of those scores. The standard error of a sample mean falls in proportion to 1 / √N, where N is the number of trials. NIST's guidance on confidence limits for a mean shows the same square-root term.
That creates diminishing returns. To cut sampling error in half, you need roughly four times as many trials. Moving from 10,000 to 100,000 uses ten times the trial count, but the expected error scale shrinks by only √10, or about 3.16. Our measured widest-spot result moved from about 1.00 point to about 0.30, almost exactly that pattern.
The interval calculation also passed a useful calibration check. Pooling six spots at each of six trial counts, the approximate 95% intervals contained exact equity in about 95.0% to 95.5% of the 12,000 estimates at each count. A 95% interval is not a 95% promise about one completed run; it describes a method that should cover the fixed truth about 95% of the time over repeated samples. See NIST's confidence-interval explanation for that repeated-sampling interpretation.
How We Built an Exact PLO5 and PLO6 Oracle
PokerStars' published Omaha rules require exactly two hole cards and exactly three community cards in the final five-card hand. Its five-card PLO guide and six-card Omaha rules confirm that the same construction applies after adding a fifth or sixth hole card. We applied that rule to PLO5 and PLO6 high with one standard 52-card deck.
- PLO5: two known five-card hands remove ten cards. The remaining 42 cards make C(42, 5) = 850,668 unordered final boards.
- PLO6: two known six-card hands remove twelve cards. The remaining 40 cards make C(40, 5) = 658,008 boards.
PLO6 has fewer possible boards here because more hole cards are already known, but each player has more two-card hole combinations to evaluate: 15 instead of 10. We did not time either evaluator, so the board counts say nothing about which variant is faster in a particular tool.
Every unordered final board is equally weighted because each one has the same 120 possible deal orders. For every board we compared the best legal Omaha hand for both players, counted wins, ties and losses, and awarded half a unit for a tie. This is complete enumeration, not sampling. The exact totals from the two independent implementations matched in all six spots.
| Spot | Hero | Villain | Wins / ties / losses | Exact equity |
|---|---|---|---|---|
| P5-A | A♠ A♥ K♠ K♥ Q♣ | J♣ T♣ 9♦ 8♦ 7♥ | 469,214 / 66 / 381,388 | 55.1622% |
| P5-B | A♠ K♠ Q♥ J♥ T♣ | A♦ K♦ Q♣ J♣ 9♠ | 294,553 / 298,784 / 257,331 | 52.1878% |
| P5-D | A♠ A♥ K♠ K♥ Q♣ | 2♣ 2♦ 2♥ 3♠ 4♠ | 669,638 / 0 / 181,030 | 78.7191% |
| P6-A | A♠ A♥ K♠ K♥ Q♣ J♣ | T♣ 9♣ 8♦ 7♦ 6♥ 5♥ | 359,603 / 0 / 298,405 | 54.6502% |
| P6-B | A♠ K♠ Q♠ J♥ T♥ 9♦ | A♦ K♦ Q♦ J♣ T♣ 8♣ | 225,107 / 255,322 / 177,579 | 53.6115% |
| P6-D | A♠ A♥ K♠ K♥ Q♣ J♣ | 2♣ 2♦ 2♥ 2♠ 3♦ 4♦ | 533,331 / 0 / 124,677 | 81.0524% |
The labels describe roles rather than a sequence: A is the widest near-even case, B is deliberately chop-heavy, and D means a deliberately lopsided synthetic stress test with clustered low pairs. The panel spans different outcome variances, but it is not a sample of the whole PLO hand space and should not be read as a starting-hand ranking. For that separate job, see our PLO starting-hand guide.
Chops Matter More to Precision Than the Variant Label
The widest spots were P5-A and P6-A: both were near 50–55% equity and almost never tied. At 10,000 trials their 95th-percentile errors were 0.99 and 1.00 points. The chop-heavy P5-B and P6-B spots came in at 0.76 and 0.75 points.
Why? A tie always contributes 0.5, exactly in the middle. A stream with many ties varies less than a stream that swings mostly between 0 and 1. Lower outcome variance means a narrower sampling distribution at the same N. That is also why the lopsided D spots converged faster than the near-even A spots.
This explains the near overlap between the PLO5 and PLO6 curves. The number of hole cards does not by itself set Monte Carlo sampling error. For a fixed scenario, the win/tie/loss distribution and the number of independent trials do. PLO6 can require more computation per evaluated board, but runtime was outside this study.
What We Simulated—and What We Did Not
After exact enumeration, each Monte Carlo replication sampled the exact win/tie/loss distribution for its spot. That is statistically equivalent to drawing five distinct cards within a uniformly random legal board, replacing the board before the next independent trial, and retaining only whether Hero won, tied or lost. We used NumPy 2.2.3's PCG64 generator with a published deterministic seed for every spot and setting. A separate card-level check sampled and evaluated 25,000 actual legal boards in each spot; all six estimates were within 1.41 standard errors of exact equity. A method that avoids duplicate boards within a run would have a narrower error profile, especially as its sample approaches the finite board count, so this ladder should not be transferred to that design unchanged.
The study does not test:
- unknown hands, opponent ranges or range weighting;
- multiway pots, double boards, dead cards or Omaha Hi-Lo;
- device speed, app output or any specific implementation;
- position, betting, fold equity, rake, equity realization or decision EV;
- a universal worst-case bound beyond these six constructed spots.
If only one or two cards remain, exact enumeration may be small enough to prefer. Our PLO wraps study, for example, evaluates all 820 turn-and-river combinations in its fixed flop cases. Monte Carlo earns its keep when the complete state space becomes too large or the model includes ranges and more players.
Where OmahaCalc Fits
To revisit an app calculation, use the OmahaCalc RECENT setup checklist to distinguish restored inputs, the current iteration setting and a freshly computed result.
The official US App Store listing for OmahaCalc, checked August 29, 2026, describes PLO5 and PLO6 Monte Carlo equity calculations with known hands and board cards, plus multi-player calculations, ranked-hand browsing, percentile filters and range analysis. We did not feed this study's hands into the app, inspect its output or measure its performance.
The useful habit applies to any Monte Carlo calculator: record the model, trial count and result; keep more digits in the calculation than in the conclusion; and rerun or increase N when the gap you care about is close to the measured error scale. Use calculation tools as off-table study aids and follow the rules of the game or platform where you play.
Download the Data and Reproduce the Study
The primary enumerator uses the open-source PH Evaluator for five-card ranks. A second implementation uses an independently written pure-Python rank tuple and a different dictionary-based board scorer. It checked every one of the 2,598,960 five-card combinations, all 7,462 distinct rank classes and every board in all six matchups. It also checked suit isomorphism, player-swap accounting, board order, duplicate cards, wheel straights, full houses and kickers.
- Exact hands, wins, ties, losses and equities (CSV)
- Every per-spot, per-variant and pooled error summary (CSV)
- All 72,000 replication rows (compressed CSV)
- Machine-readable inputs, seeds, results, checksums and limitations (JSON)
- Primary generator (Python) and independent verifier (Python)
- Pinned Python dependencies and verification report
Download the two scripts, requirements file and exact-matchup CSV into one folder. After installing the pinned requirements, run the generator and verifier from that folder; both write regenerated artifacts to plo-monte-carlo-output. A full run exhaustively evaluates all six matchups, so it can take several minutes.
PLO Monte Carlo Accuracy FAQ
- Is 10,000 Monte Carlo trials enough for PLO equity?
- It was enough for a quick estimate in this panel: even the widest spots had a 95th-percentile absolute error of about one percentage point. It was not enough to resolve a difference of a few tenths reliably. Your required precision and model matter more than a universal preset.
- Why does the same hand show a different equity on repeated runs?
- Monte Carlo samples random legal outcomes. Different samples contain slightly different proportions of wins, ties and losses, so their means move around the fixed true equity. More trials narrow that movement; they do not make one sampled result exact.
- Does PLO6 need more trials than PLO5?
- Not automatically. In these six fixed-hand spots, the PLO5 and PLO6 error curves were nearly identical. Sampling precision depended on outcome variance and N. PLO6 has more legal two-card choices inside each hand, which can affect computation time, but this study did not benchmark speed.
- Is exhaustive equity always better than Monte Carlo?
- It is preferable when the exact state space is tractable and the model is correct. Monte Carlo becomes useful when ranges, more players or more unknown cards make full enumeration expensive. An exact answer to the wrong range assumption is still the wrong model.
- Does a more precise equity estimate tell me the correct poker action?
- No. This experiment measures showdown equity for fixed hands. A decision also depends on ranges, pot odds, position, stack depth, future actions, folds and sometimes rake or tournament payouts. Precision in one input is not a complete strategy.
Sources and method references
- Apple App Store: OmahaCalc — current public product evidence, accessed August 29, 2026.
- PokerStars: Omaha rules, five-card PLO rules and six-card Omaha rules — accessed the same day.
- NIST/SEMATECH: confidence limits for a mean and confidence-interval interpretation — accessed the same day.
- NumPy 2.2: PCG64 and multinomial sampling — accessed the same day; the bundle pins NumPy 2.2.3.
- PH Evaluator source repository — accessed the same day; the bundle pins phevaluator 0.6.0.