
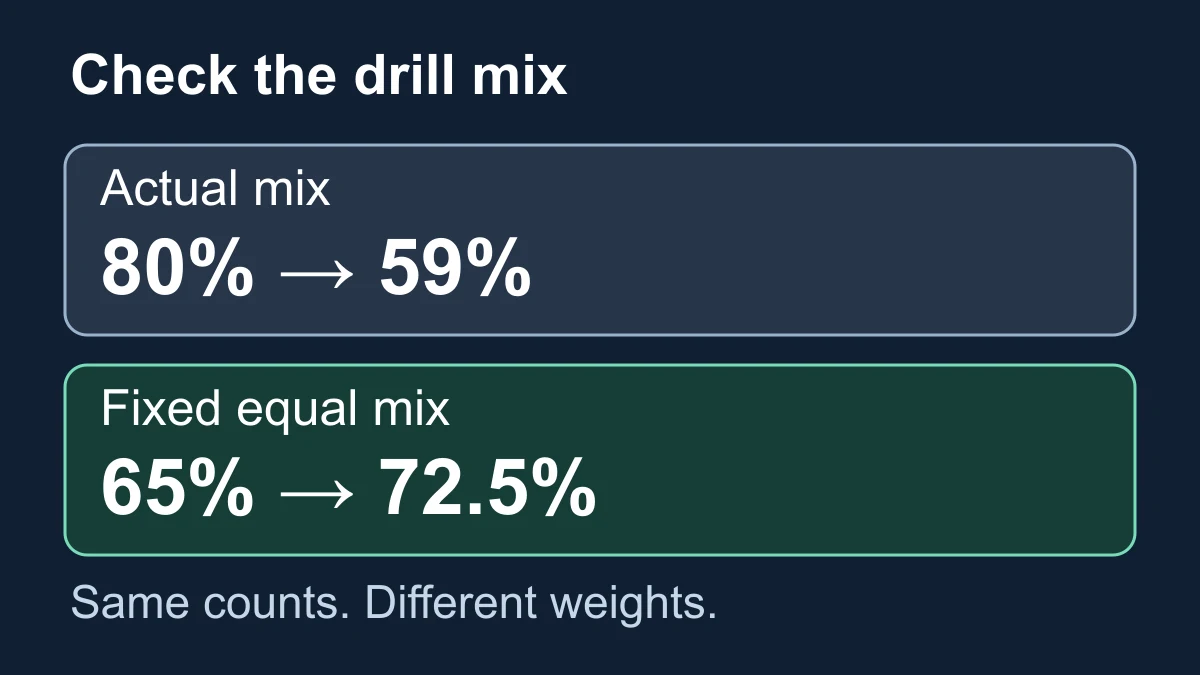
Your poker trainer accuracy can fall even when your recorded accuracy rises in every drill category. If the later session contains more of the categories where you score lower, the overall percentage can move down. Before treating that as regression, compare the category counts and calculate both periods using one fixed mix.
In the invented record below, overall accuracy falls from 80% to 59%, a decline of 21 percentage points. Giving the two fixed sets equal weight instead produces 65% to 72.5%, a rise of 7.5 points. Keep both results: one describes the attempts completed; the other compares recorded set rates on a common mix. Neither proves that skill improved.
Start with the counts behind the percentage
Imagine two fixed drill sets in a manual study record. Set A contains familiar situations; Set B contains situations still being developed. Keep those memberships unchanged between periods. These are illustrative labels, not an app’s difficulty classifications.
For this example, an “accepted” decision passes one unchanged binary grading rule. We are not defining the scoring formula of GTO Gecko or another trainer. In mixed-strategy spots, selecting a lower-frequency action is not automatically an error; preserve the actual reference and grading rule used for your record.
All counts are invented. Each attempt belongs to one set. On narrow screens, scroll to compare both periods.
| Fixed set | Earlier accepted / attempts | Earlier rate | Later accepted / attempts | Later rate |
|---|---|---|---|---|
| A: familiar | 72 / 80 | 90% | 19 / 20 | 95% |
| B: developing | 8 / 20 | 40% | 40 / 80 | 50% |
| All attempts | 80 / 100 | 80% | 59 / 100 | 59% |
Earlier, Set A supplied 80% of attempts. Later, it supplied only 20%. The later period put most of its attempts into Set B, which still had the lower recorded rate even after rising from 40% to 50%.
The pooled 59% is correct: 59 of the later 100 decisions were accepted. It answers “What fraction of these attempts passed?” It does not isolate a change within a fixed task mixture. The danger of combining groups is the subject of Simpson’s original paper on contingency tables; the poker counts here are our own constructed example.
Compare both periods on one fixed mix
Choose a reference mixture and apply it to both periods. This is the weighted-rate arithmetic used in direct standardization; the linked method supplies a statistical reference, not evidence that this poker worksheet measures learning. Giving the two sets equal importance means a 50% weight for each:
Earlier: 0.50 × 90% + 0.50 × 40% = 65%
Later:   0.50 × 95% + 0.50 × 50% = 72.5%
Change:  +7.5 percentage points
This is a fixed-mix percentage. It is not the percentage actually achieved over either period’s 100 attempts, and it is not an app rating. The same reference weights make the two summaries answer the same composition question.
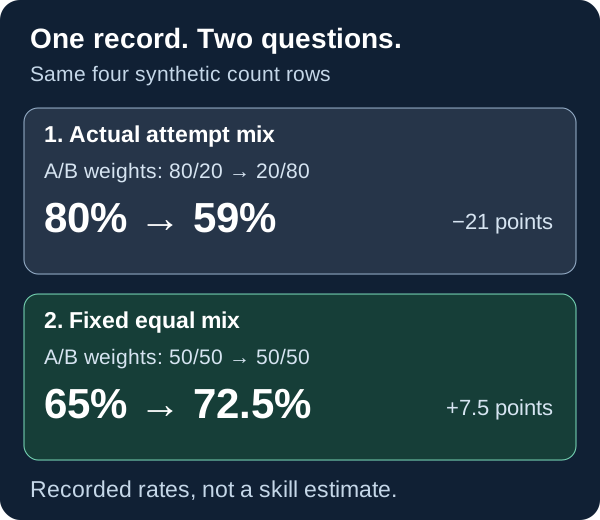
There is no universal correct reference mix. Equal weights give both sets equal importance. Keeping the earlier period’s 80/20 mix asks a different question. For future comparisons, record the weights and their purpose before collecting the later results. When exploring an existing record, label the weight choice retrospective and show how another reasonable mix changes the answer.
Each row applies its stated weights to both periods. “Points” means percentage points.
| Reference A / B | Earlier | Later | Change |
|---|---|---|---|
| 50% / 50% | 65% | 72.5% | +7.5 points |
| 80% / 20%: earlier mix | 80% | 86% | +6 points |
| 20% / 80%: later mix | 50% | 59% | +9 points |
Here both set rates rise, so every common nonnegative mix has a higher later value. If one set rises and another falls, even the direction can depend on the weights. Do not search through mixtures until one produces a flattering result.
Use a benchmark record alongside your practice plan
Download the printable comparison worksheet. It includes the completed equal-weight example and a blank record. It is a manual sheet, not an automatic calculator.
- Define the sets. Record the game, positions, stack depth, action context, reference solution and scoring rule. Keep set membership stable.
- Record accepted and attempted counts. Use the same treatment of hints, retries and revealed answers in both periods. Keep the method of selecting situations within each set comparable.
- Declare nonnegative weights that sum to 100%. Choose them for a stated study question, then keep them fixed across the comparison.
- Calculate each set’s rate, then its weighted contribution. Multiply by the weight as a fraction: 50% weight × 90% rate contributes 45 percentage points. Add the contributions separately for the earlier and later periods. Retain the raw pooled rates too.
- Write a bounded conclusion. For the example: “The equal-set benchmark rose 7.5 points; the attempted mix shifted toward Set B. This record does not establish lasting learning.”
Reference weights do not dictate how to allocate practice time. You can spend more time on a difficult set while retaining a stable comparison framework. Use our poker practice guide to organize the sessions; use this record to describe their composition.
When the comparison is unavailable or misleading
No attempts is not 0% accuracy. If a set has positive reference weight but zero attempts in at least one period, that period’s set rate is undefined, so the two-period benchmark comparison is unavailable. For example, if Set A has 20 earlier attempts and no later attempts, the earlier benchmark may still be calculable; the later one is not. Do not replace it with zero, reuse the old rate, or silently spread its weight across the other sets. Collect comparable attempts, or explicitly define a narrower benchmark and report the excluded set.
If you only have the two overall percentages, you cannot reconstruct the missing set counts. Start a prospective record rather than inventing an adjusted historical score.
Fixed weights also cannot correct a changed problem mix inside a set. If “river decisions” becomes mostly easy checks in the later period, keeping that row at 50% does not make the comparison equivalent. A changed solution, grading rule or use of hints can break comparability too.
Finally, these are recorded rates, not precise estimates of ability. The 100 attempts per period make the arithmetic easy; they are not a recommended sample size. Repeated decisions and chance variation remain relevant. Our guide to poker-stat denominators and uncertainty explains why counts matter, but its opponent-stat intervals should not be automatically transplanted to correlated trainer attempts.
Keep feedback and measurement separate
Accuracy does not measure the modeled cost of an error. After checking whether the samples are comparable, use EV-loss review to investigate costly patterns rather than treating every rejected decision as equally important.
For off-table practice, GTO Gecko offers simulated study scenarios with solver feedback. Review the available decisions and their frequencies, then keep any fixed-mix comparison in your own study record.
Disclosure: GTO Solutions AS publishes this site and GTO Gecko. Product evidence was checked on September 6, 2026. The binary grading example and worksheet are independent editorial tools, not app output or a description of an in-app benchmark feature.
Method and downloads
The four count rows, exact results and 101-weight check are public. With Set A weight w, the earlier fixed rate is 0.40 + 0.50w and the later rate is 0.50 + 0.45w. Their difference is 0.10 − 0.05w: between 5 and 10 percentage points for weights from zero to one.
Run the standard-library Python generator and independent checker using the reproduction instructions. The checksum manifest records the publication files. This is exact arithmetic on invented counts, not a simulation, controlled learning study or analysis of product users.
- E. H. Simpson (1951), original paper, especially pages 240–241: interpreting grouped and combined data.
- CDC WONDER, fixed-reference weighted-rate method: mathematical background for standardization; not poker-learning evidence.
- GTO Gecko, official US App Store listing: current product scope.
External sources accessed September 6, 2026. No causal improvement, lasting retention, table performance or financial result is established by this comparison.