

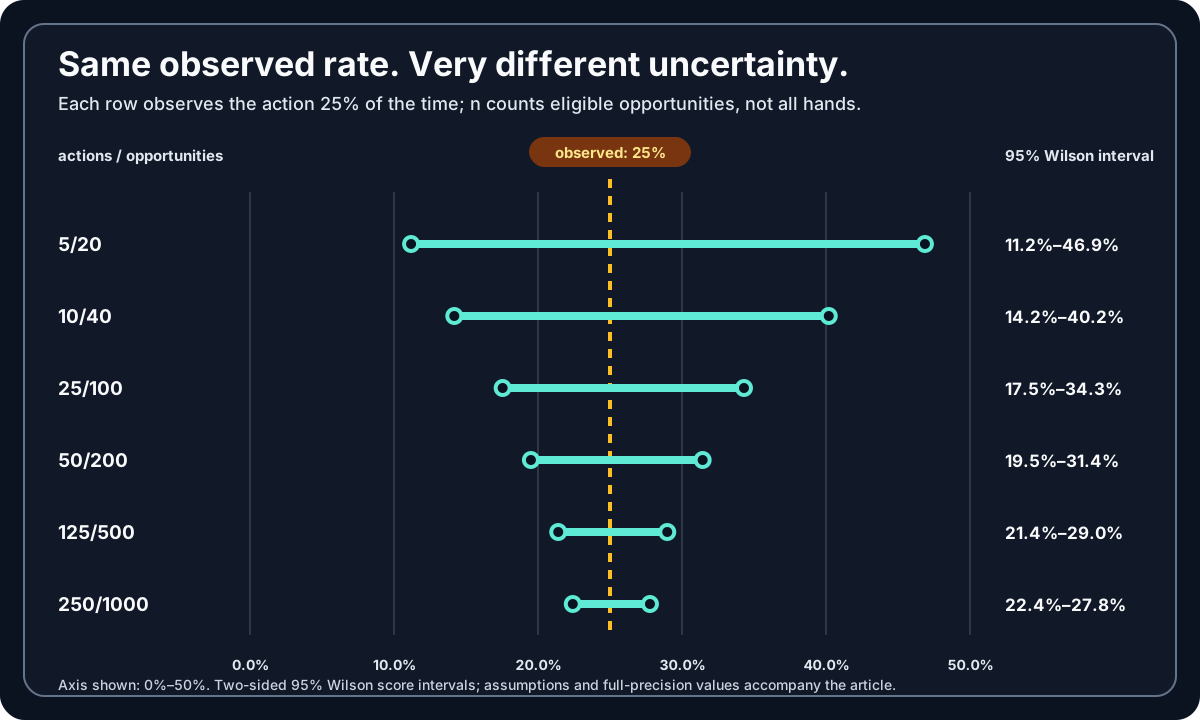
A poker stat is not trustworthy after one universal number of hands. Start with the number of eligible opportunities, keep the result as an action count over that denominator, attach an uncertainty interval, and check whether the observations came from a comparable context. A displayed 25% could mean 5 actions in 20 opportunities or 125 in 500. The headline is identical; the evidence is not. Their two-sided 95% Wilson intervals are 11.2%–46.9% and 21.4%–29.0%.
Every numerical player example below is synthetic. No customer, player-pool, or private hand-history data was used. The intervals describe binomial sampling uncertainty under a declared model; they do not diagnose a person or select a profitable response. Disclosure: GTO Solutions AS publishes GTO Gecko and the two practice products discussed near the end.
The Denominator Is Opportunities, Not Hands
For a frequency stat, preserve three values: the action count x, the eligible-opportunity count n, and the estimate x/n. An eligible opportunity is one in which the defined action could actually occur. A player cannot 3-bet without first facing a raise and having action reach them; a player cannot make a flop continuation bet without being the preflop aggressor, reaching the flop, and having the relevant betting opportunity.
PokerTracker's current Basic HUD Guide, checked September 4, 2026, lists total hands separately from 3-bet, flop c-bet, and fold-versus-flop-c-bet frequencies “given the opportunity.” Its Advanced HUD Guide documents an occurrences/opportunities display such as 20% (2/10) and position filters. Those are product-specific examples, so inspect the definition and active filters in the tool you actually use.
Suppose a player appears in 500 tracked hands, has 20 qualifying 3-bet opportunities, and raises 5 times. The statistical observation is 5/20 = 25%, not “25% over 500.” Treating that 25% as if it came from 500 eligible opportunities would inflate the denominator 25-fold and invent 125 actions. If a report gives only a rounded percentage and total hands, do not reverse-engineer an exact conditional count that is not there.
If you already have the action and opportunity counts, try the count-first Wilson calculator. Keep reading for what its interval does—and does not—mean.
How Uncertain Is a 25% Poker Stat?
Every row in the chart observes exactly 25%. The eligible-opportunity count—and the matching action count—increases while the proportion stays fixed. The marker stays put as the interval narrows.
Narrow screen? Scroll the chart horizontally to compare every opportunity count and interval endpoint.
Narrow screen? Scroll the table horizontally to inspect every endpoint and interval width.
| Actions / opportunities | Observed | 95% Wilson interval | Interval width |
|---|---|---|---|
| 5 / 20 | 25.0% | 11.2%–46.9% | 35.7 pp |
| 10 / 40 | 25.0% | 14.2%–40.2% | 26.0 pp |
| 25 / 100 | 25.0% | 17.5%–34.3% | 16.8 pp |
| 50 / 200 | 25.0% | 19.5%–31.4% | 11.9 pp |
| 125 / 500 | 25.0% | 21.4%–29.0% | 7.6 pp |
| 250 / 1,000 | 25.0% | 22.4%–27.8% | 5.4 pp |
At a fixed observed rate under this model, more opportunities narrow sampling uncertainty; they do not make the estimate certain. Five hundred total hands might create hundreds of opportunities for one broad preflop stat and very few for a rare river branch. Even the same n can be adequate for a coarse study decision and inadequate for a close one.
A Decision Threshold Is Not a Reliability Badge
Imagine an arbitrary study rule declared before seeing these examples: investigate one branch only when a frequency is below 30%. The 5/20 interval crosses 30%, so the sample does not resolve that rule. The 125/500 interval lies entirely below 30% under the stated model. The cutoff is not poker truth or a player-type boundary; this simply shows how a denominator can change a decision while the displayed 25% stays fixed.
Why Wilson Beats the Familiar Shortcut
The familiar Wald interval takes the observed proportion and adds and subtracts 1.96 standard errors. It is simple, but NIST's proportion-interval guidance notes that this symmetric approximation can produce impossible bounds below 0 or above 1. Brown, Cai, and DasGupta's primary comparison of binomial intervals documents the Wald interval's erratic coverage and recommends better-performing alternatives, including Wilson.
For the synthetic case 1/10, Wald gives −8.6% to 28.6%; a negative action frequency is impossible. Wilson gives 1.8% to 40.4%. At 0/10, Wald collapses to 0%–0%, while Wilson preserves the uncertainty that ten observations cannot remove.
For observed proportion p̂ = x/n and z = 1.959963984540054, the two-sided 95% Wilson construction used here is:
center = (p̂ + z²/(2n)) / (1 + z²/n)
half-width = z × sqrt[p̂(1−p̂)/n + z²/(4n²)] / (1 + z²/n)
interval = center ± half-width
The independent verifier also reproduces NIST Dataplot's published 8/30 benchmark: 0.141827 to 0.444480 after six-decimal rounding. That checks the implementation against a published reference; it is not peer review or proof that a fixed-rate binomial model describes a player.
What Does Zero in N Actually Tell You?
Zero out of zero is undefined. If no eligible opportunity occurred, there is no proportion to estimate. A report should show a dash, “not available,” or 0/0—not 0%.
Zero out of n is an observed zero. If the action occurred zero times in genuine opportunities, the point estimate is 0%, but nonzero rates remain compatible with the sample.
Narrow screen? Scroll the table horizontally to compare the two interval questions and the approximation.
| Actions / opportunities | Observed | Two-sided 95% Wilson upper | Exact one-sided 95% upper | 3/n approximation |
|---|---|---|---|---|
| 0 / 10 | 0.0% | 27.8% | 25.9% | Not shown |
| 0 / 25 | 0.0% | 13.3% | 11.3% | Not shown |
| 0 / 50 | 0.0% | 7.1% | 5.8% | 6.0% |
| 0 / 100 | 0.0% | 3.7% | 3.0% | 3.0% |
| 0 / 250 | 0.0% | 1.5% | 1.2% | 1.2% |
The upper endpoint of the two-sided 95% Wilson interval and the exact one-sided bound answer different coverage questions, so they are not interchangeable. A two-sided 95% interval splits 5% noncoverage across two tails; a one-sided 95% bound uses the full 5% in one tail. For that predeclared one-sided zero-event question, the exact binomial upper limit is 1 − 0.05^(1/n). The classic 3/n rule roughly approximates that exact one-sided limit; following Hanley and Lippman-Hand's primary 1983 note, the bundle displays it only above 30 observations. Zero observed is evidence, never proof of impossibility.
Why Context Splits Can Reverse the Read
More data helps only when it estimates the quantity you care about. The synthetic table below uses one declared action but two different situations.
Narrow screen? Scroll the table horizontally to compare both contexts with their pooled rate.
| Slice | Actions / opportunities | Observed | 95% Wilson interval |
|---|---|---|---|
| Context A | 20 / 50 | 40.0% | 27.6%–53.8% |
| Context B | 5 / 50 | 10.0% | 4.3%–21.4% |
| Pooled | 25 / 100 | 25.0% | 17.5%–34.3% |
The pooled 25% is arithmetically correct and can still answer the wrong poker question. The difference could reflect position, stack depth, game format, prior action, sizing, lineup, or a change over time. If A was collected first and B later, context and drift are confounded; this table cannot identify the cause.
Split on conditions that define a meaningfully different decision, preferably chosen before viewing the result. Searching many slices after the fact creates more chances to promote noise into a story. Report each slice's own x/n and interval instead of carrying the pooled precision into a smaller subgroup. Our broader betting-pattern guide covers what to record; this page owns the uncertainty attached to the count.
Plan in Opportunities, Then Estimate Hands
If a target is m eligible opportunities and a qualifying situation independently appears at a stable assumed rate q across comparable hands, the expected total hand count is m/q. For a target of 100 opportunities:
| Assumed opportunity rate | Expected total hands |
|---|---|
| 50% | 200 |
| 25% | 400 |
| 10% | 1,000 |
| 5% | 2,000 |
These assumed rates are illustrations, not measured poker-population frequencies. The totals are expectations, not deadlines or guarantees. Eligibility can change with position, table behavior, filters, and time; count actual opportunities as they arrive. Nor is 100 a universal target. Choose precision for the decision, not a round hand count for the dashboard.
A Safer Workflow for Using Player Stats
- Define the event. Write exactly what action counts and when it was legally available.
- Expose the denominator. Record
x/n, not only a rounded percentage or total hands. - Add sampling uncertainty. Use a named interval method and confidence level; the count-first calculator implements the two-sided 95% Wilson method used here.
- Match the context. Check position, stack, format, action history, sizing, lineup, and collection window where relevant.
- Compare the whole interval with a predeclared decision boundary. If materially different plans remain compatible with the interval, preserve that uncertainty rather than forcing a label.
- Cross-check the story. Use showdowns, sizes, sequence-level notes, and a sound strategic baseline; one percentage should not classify a person.
This is an off-table evidence workflow. Follow the rules of the poker room or platform where you play. A statistically clearer read still does not specify the correct exploit; game-tree costs, ranges, sizes, position, stack depth, and the risk of being wrong belong to the separate strategy decision. Our GTO-versus-exploitative guide covers that later step.
Method, Independent Check, and Downloads
The public JavaScript generator writes every synthetic table, the chart, and the calculator from frozen inputs. A separately written Python standard-library verifier recomputes Wilson, Wald, and exact zero-event results without importing or invoking the JavaScript implementation. It also checks the NIST 8/30 benchmark, context totals, decision-threshold relation, opportunity-planning matrix, CSV/JSON agreement, invariants, and SHA-256 hashes.
Use the calculator or audit the complete evidence bundle:
- Interactive count-first Wilson calculator
- Method, equations, data dictionary, reproduction commands, and limitations
- Complete full-precision reference data (JSON) and frozen verification report (JSON)
- Same-rate Wilson cases, zero-event cases, and Wilson-versus-Wald cases
- Context split, decision-threshold illustration, and opportunity-planning matrix
- Primary JavaScript generator, independent Python verifier, and SHA-256 manifest
The frozen report records the release-time cross-check between two implementations; rerun verify.py to validate the files you downloaded. Agreement does not validate a tracker definition, establish independence, prove that a player's rate is stable, or certify a strategic adjustment.
Where the Practice Tools Fit
The current Felted support page, checked September 4, 2026, lists descriptive VPIP, PFR, 3-bet, c-bet, and position breakdowns inside its play-money environment. Treat those percentages as summaries and apply the same count-and-context questions; this article does not claim that Felted displays Wilson intervals, exports the data, or tracks opponents.
The current support page for Live Poker Trainer—still titled “Player Type Trainer”—was checked the same day and describes practice against four deliberately selected models: Fish, Nit, Maniac, and GTO, using precomputed solver data. A cautious hypothesis can choose a controlled practice contrast, but those fixed models are not evidence that a real person belongs to a stable type. The app does not validate this statistical method, and no app binary was installed or tested for this article. For the separate product workflow, see our trainer walkthrough.
Limits of the Model
A binomial model treats the count as the number of successes in a fixed number of independent Bernoulli trials with one stable success probability—the assumptions stated in the NIST definition. Repeated poker decisions by one person can be dependent. Opponents adapt, table composition changes, and the same label can hide different decision trees. Filters, missing histories, site rules, and selection can also distort the denominator.
A Wilson interval quantifies sampling uncertainty conditional on the model and recorded counts. It does not quantify every source of uncertainty, forecast one particular future action, test the cause of a context split, or estimate an entire population from these synthetic examples. At nominal 95% confidence, the frequentist claim is about the procedure: across repeated samples generated by the model, intervals built this way are designed to cover the fixed rate about 95% of the time. It is not a 95% posterior probability statement about this one completed interval.
Missing hand labels create a separate problem from sampling uncertainty. Our shown-bluffs exercise keeps a complete twenty-bet record fixed and shows why the classified hands alone do not establish the bluff share among all twenty bets.
The practical conclusion is deliberately modest: keep the numerator, denominator, interval, and context together. If any one is missing, the displayed percentage is not enough.
Sources
- PokerTracker 4, Basic HUD Guide, Advanced HUD Guide, and Custom Statistics Guide. Used for documented stat definitions, action/opportunity display, and filtering behavior; accessed September 4, 2026.
- NIST/SEMATECH, Confidence intervals for a proportion, and NIST Dataplot, Proportion Confidence Interval. Used for the Wilson construction and published 8/30 benchmark; accessed September 4, 2026.
- Brown, Cai, and DasGupta, Interval Estimation for a Binomial Proportion, Statistical Science 16(2), 2001. Used for interval-method performance context; accessed September 4, 2026.
- National Institute of Standards and Technology, Binomial Distribution. Used for the fixed-probability, independent-Bernoulli model boundary; accessed September 4, 2026.
- Hanley and Lippman-Hand, If Nothing Goes Wrong, Is Everything All Right?, JAMA, 1983, DOI 10.1001/jama.1983.03330370053031. Used for the zero-event calculation and rough rule-of-three scope; accessed September 4, 2026.
- GTO Gecko, public method, data dictionary, reproduction commands, and limitations, generated and independently checked September 4, 2026.
- GTO Solutions AS, official US Apple developer page. Used for publisher identity and current portfolio names; accessed September 4, 2026.
- GTO Gecko, Felted support and Player Type Trainer support. Used only for the narrow product roles stated above; accessed September 4, 2026.