

Pocket aces have a mean waiting time of 221 hands, but half of first-AA waits finish by hand 153. You need 508 hands before the chance of seeing AA at least once first exceeds 90%. A 500-hand stretch with no pocket aces still occurs 10.3563% of the time under the model below.
The familiar “once every 221 hands” figure is a per-hand probability and a long-run average. It is not a delivery schedule. This article turns it into a complete waiting-time distribution, then repeats the calculation for other starting-hand events and for collecting several AA examples.
Method note: all results assume one fixed seat in standard 52-card Texas Hold’em, with two private cards and a fresh independent shuffle each hand. They are exact calculations, not observed user data, app output, a fairness test, or a strategy-profit claim.
Six AA combinations produce the 1-in-221 figure
There are C(52,2) = 1,326 unordered two-card starting combinations. Any two of the four aces make AA, so there are C(4,2) = 6 pocket-ace combinations:
P(AA on one hand) = 6 / 1,326 = 1 / 221 = 0.452489%
The current PokerStars Hold’em rules provide the ordinary two-private-card game model used here. Our combo-counting guide explains why a pocket pair has six physical suit combinations. From this point onward, the question changes from “what is the chance on one deal?” to “how many independent deals pass before the first hit?”
Mean 221, median 153, and 90% at 508 answer different questions
If the per-hand success probability is p, the chance of seeing at least one success within n independent hands is:
P(at least one by hand n) = 1 − (1 − p)n
This is the cumulative form of a geometric waiting-time model. The mean first-hit wait is 1/p, which gives 221 hands for AA. The median instead asks for the first integer n where the cumulative chance reaches 50%. That happens at 153.
| Measure | Hands | What it means |
|---|---|---|
| Mean | 221 | The long-run average of many first-AA waits. |
| Median | 153 | At least 50% of first-AA waits finish by this hand. |
| 90% point | 508 | At least 90% finish by this hand. |
| 95% point | 661 | At least 95% finish by this hand. |
The mean sits to the right of the median because the distribution has a long tail. Most waits finish before 221 hands, while a smaller number of very long droughts pull the average upward. At the mean itself, the chance of at least one AA is about 63.30%, not 50% and not 100%.
Narrow screen? Scroll horizontally to inspect the labels.
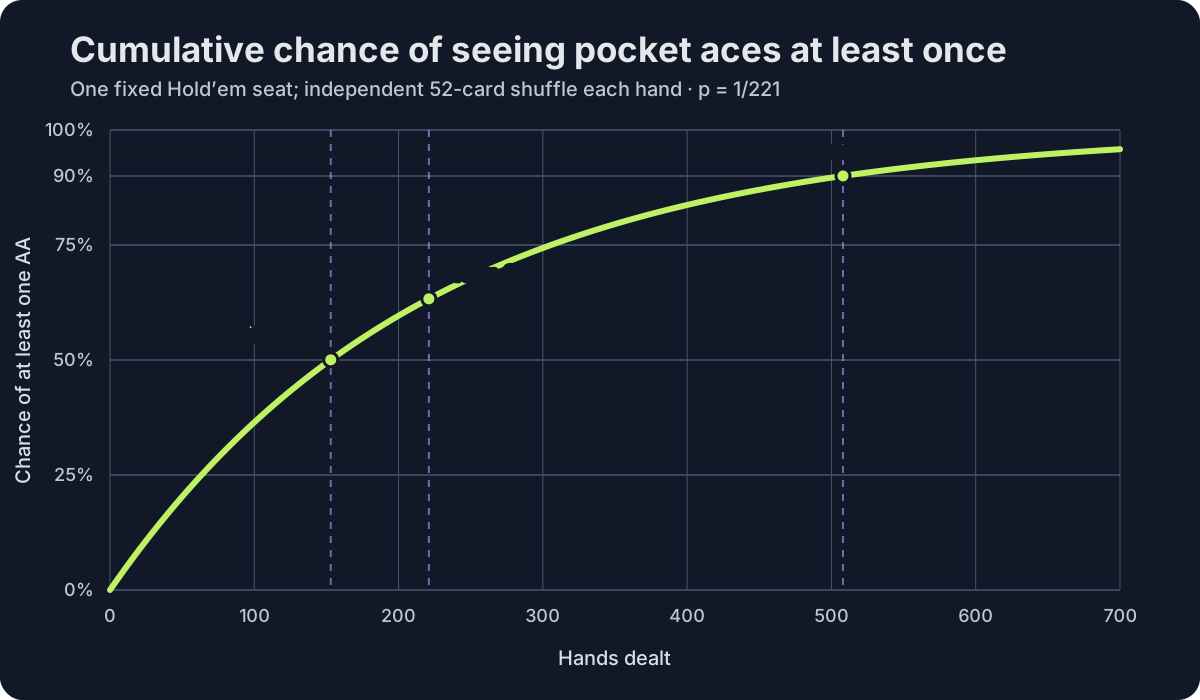
p=1/221; plotted values are rounded for publication. The 0–1,000-hand CSV contains every plotted value.Five hundred hands without AA is unusual, not astonishing
The probability of no AA in n hands is the complement, (220/221)n. At 500 hands it is 10.3563%—roughly one such stretch in 9.66 under repeated independent 500-hand windows. That number does not say a particular shuffle is fair, only that the card drought is compatible with this simple fair-deal model.
| Hands | At least one AA | No AA |
|---|---|---|
| 100 | 36.4610% | 63.5390% |
| 153 | 50.0366% | 49.9634% |
| 221 | 63.2954% | 36.7046% |
| 500 | 89.6437% | 10.3563% |
| 1,000 | 98.9275% | 1.0725% |
Under independent fresh shuffles, a 500-hand miss does not make AA “due.” The next hand remains 1/221. This memoryless result is easy to confuse with a statement about the quality of a real shuffle. It is not one: our hand-history shuffle article explains why one selected count cannot certify or disprove a dealing process.
A “1 in N” event needs its own waiting distribution
The same calculation applies after the event is defined precisely. The table below keeps a fixed seat and independent deals. “One exact suited combo” means one named physical pair such as A♠K♠; AK without a suit restriction has 16 combinations.
| Event | Per hand | Mean | Median | 90% point |
|---|---|---|---|---|
| One exact suited combo | 1 / 1,326 | 1,326 | 919 | 3,053 |
| AA | 1 / 221 | 221 | 153 | 508 |
| AK, any suits | 8 / 663 | 82.875 | 58 | 190 |
| QQ, KK or AA | 3 / 221 | 73.667 | 51 | 169 |
| Any pocket pair | 1 / 17 | 17 | 12 | 38 |
| Pocket pair, then a rank match in a hypothetical flop | 144 / 20,825 | 144.618 | 100 | 332 |
“Once every N” and the mean are numerically identical for a geometric wait, but the other columns are not optional decoration. If you need a 90% planning threshold rather than an average, AA takes 508 hands and one exact suited combo takes 3,053.
Conditional opportunities and total hands are different denominators
Suppose the target is: you are dealt a pocket pair, and at least one of the two remaining cards of that rank appears in a hypothetical three-card flop runout. For this unconditional card-frequency calculation, we deal that runout every hand—even when live action would end before a flop was revealed. Given the pocket pair, there are C(50,3)=19,600 possible runouts. Exactly C(48,3)=17,296 contain neither matching card, so:
P(rank match on flop | pocket pair) = 1 − C(48,3) / C(50,3) = 144 / 1,225 = 11.7551%
P(pocket pair and rank match) = 1/17 × 144/1,225 = 144/20,825 = 0.691477%
The conditional wait averages 8.507 pocket-pair opportunities. From all starting hands, the combined event averages 144.618 hands, has a 100-hand median, and reaches 90% at 332 hands. The event includes an ordinary set, a full house when the other two flop cards pair, or quads when both remaining rank-mates appear.
This is not the rate among flops you actually observe: preflop decisions select which hands reach a visible flop. It also does not say that calling preflop to chase a set is profitable. Stack depth, call price, ranges, later betting and rake belong to the separate set-mining implied-odds decision.
Collecting several AA examples takes a negative-binomial wait
One AA deal is rarely enough to review every position and action. The wait until the fifth or tenth occurrence follows a negative-binomial model: reaching target r by hand n is the same event as recording at least r successes in n hands. The Penn State probability course gives the distribution definition; our release computes the integer thresholds directly.
| Target | Mean | Median | 90% point |
|---|---|---|---|
| First AA | 221 | 153 | 508 |
| Fifth AA | 1,105 | 1,032 | 1,765 |
| Tenth AA | 2,210 | 2,137 | 3,137 |
| Twentieth AA | 4,420 | 4,347 | 5,722 |
These are card-arrival targets, not sample-size recommendations. Twenty AA hands can still contain twenty different action histories, opponents, stacks and boards. Count the decision opportunity you are studying, not just the hand label.
Use natural frequency to plan study, not to predict the next deal
- Name the event before counting. “AA,” “any premium pair,” and “AA facing a 3-bet” have different denominators.
- Choose the planning measure. Use the mean for long-run workload; use a cumulative threshold such as 90% when you need a completion probability.
- Count hands, then convert to time. Hands per hour and simultaneous tables change wall-clock time, not per-hand AA probability.
- Separate arrival from decision quality. A rare deal says nothing by itself about the best action or its EV.
- Review off the table. Natural play delivers examples unevenly; structured study can revisit the decision without waiting for the deck.
GTO Gecko is published by the same team as this article. The current Japanese Apple listing and Google Play listing describe plan-dependent libraries of precomputed preflop and postflop ranges, action frequencies and EV estimates, plus guided simulated practice. Use that kind of off-table review to study a decision; do not treat it as a forecast of which cards will arrive. GTO Gecko is educational software and does not provide wagering, prizes or real-money play.
Method, downloads and limits
The public release uses no random seed because every result is analytic. The JavaScript generator stores exact rational event definitions, writes the 1,001-row AA cumulative table, evaluates repeat waits and generates both language charts. A separate Python implementation rebuilds the combinations and CDF thresholds, checks every CSV row and verifies the SHA-256 manifest.
- Method and reproduction README
- Assumptions, equations and complete results JSON
- Six-event waiting-time CSV
- AA cumulative distribution, hands 0–1,000
- Repeated-AA wait table
- JavaScript generator and independent Python verifier
- SHA-256 manifest
The independent-hand assumption is a model boundary. It excludes jokers, short-deck games, exposed or removed cards, misdeals and any defective dealing process. The combined pocket-pair/flop row is a hypothetical full runout on every hand, not an observed-flop statistic. Table size does not change one fixed seat’s two-card probability, but it changes how quickly hands are dealt in clock time. None of these waiting-time results supplies a preflop range, opponent model, all-in equity, tournament value or profit estimate.
Frequently asked questions
- Is 221 hands the most likely AA wait?
- No. The single most likely first-hit hand is hand one, and each later exact hand is slightly less likely. The mean of the long-tailed distribution is 221; its median is 153.
- How many hands give a 95% chance of seeing AA?
- 661 hands for one fixed seat under independent fresh shuffles. At 660 hands the cumulative chance remains just below 95%; at 661 it first crosses the threshold.
- Does a 500-hand AA drought make the next hand more likely?
- No under this model. The next independently shuffled hand remains 1/221. The 500-hand history changes how surprised you are by the completed stretch, not the cards left in a newly shuffled deck.
- Does playing nine-handed change my AA probability?
- Not for your own fixed seat before any cards are exposed: it remains 6/1,326. More seats change the probability that somebody at the table has AA and may change hands per hour; those are different questions not modeled here.
Sources
- PokerStars: Texas Hold’em Poker — current ordinary game rules and card-use definition, accessed September 11, 2026.
- Stanford CS109 distribution review — geometric and negative-binomial definitions and expectations, accessed September 11, 2026.
- Penn State STAT 414, Lesson 11 — geometric and negative-binomial distributions, accessed September 11, 2026.
- NIST geometric quantile documentation — independent distribution reference, accessed September 11, 2026. NIST counts failures before the first success; our waits add the successful hand.