

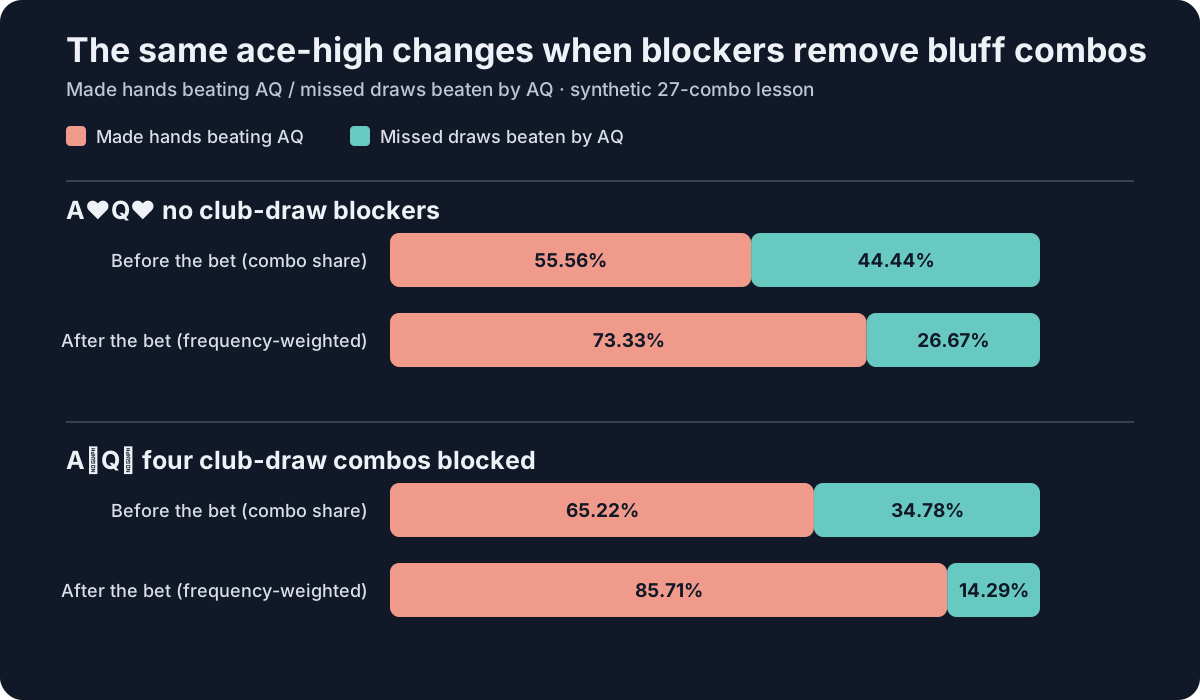
After you observe an action, do not keep every hand that might take it and count those hands equally. For each physical combo, multiply its pre-action reach weight by that hand’s action frequency, remove card conflicts, and normalize. In our 27-combo river example, a pot-sized bet changes the bluff share from 44.44% to 26.67%. The corresponding call EV is −20 chips, not the +33.33 chips produced by equal-count filtering.
This article makes that update completely auditable. We enumerate every combination on K♦ 9♣ 7♥ 4♣ 2♠, assign a declared bet frequency to each, repeat the calculation after Hero’s clubs block four bluff combos, and connect the posterior to a river call. The fixture is synthetic: its range and frequencies are teaching inputs, not a solve, a population read, or a recommendation.
Update rule: unnormalized weight after the bet = card compatibility × pre-bet reach weight × P(bet | hand). Divide every surviving weight by their total.
That is Bayes’ rule written in range language. The hand’s reach weight is the prior, its action frequency is the likelihood, and the normalized result is the posterior. PioSOLVER’s documentation states the same operational relationship: an action range is the range before the action multiplied by the strategy for that action. The arithmetic is general; the numbers below belong only to our declared model.
In this fixture, frequency weighting reverses both naive calls
Before Villain bets, Hero’s exact cards determine which physical combinations can exist. After the bet, action frequencies change their relative weights. The “naive” column below merely keeps every legal combo with a nonzero bet frequency and weights it equally.
| Hero | Legal prior | Prior missed-draw share | After-bet missed-draw share | Correct call EV | Naive call EV |
|---|---|---|---|---|---|
| A♥Q♥ | 27 combos | 12/27 = 44.44% | 4.8/18 = 26.67% | −20.00 | +33.33 |
| A♣Q♣ | 23 combos | 8/23 = 34.78% | 2.2/15.4 = 14.29% | −57.14 | +4.35 |
Both hands hold unpaired AQ and make ace-high (A-K-Q-9-7). They beat every listed missed club draw and lose to every listed set or two pair. A♣Q♣ removes four of Villain’s possible missed-club combinations, so its posterior contains even fewer bluffs. No equity approximation is hiding inside the calculation: on this completed board, each legal hand is a win or a loss for Hero.
The full values shown in this chart also appear in the table above. Scroll horizontally on a narrow screen.
Freeze the 27-combo fixture before calculating
Villain reaches this completed river with exactly the hands below. Every listed combo has pre-bet reach weight 1; every unlisted combo has weight 0. A “100% bet” means a likelihood of 1 inside this model, not certainty about a real opponent.
| Group | Exact combos | Count | Bet frequency | Bet mass |
|---|---|---|---|---|
| 99 sets | 9♠9♥, 9♠9♦, 9♥9♦ | 3 | 100% each | 3.0 |
| 77 sets | 7♠7♣, 7♠7♦, 7♣7♦ | 3 | 100% each | 3.0 |
| K9 two pair | K♠/K♥/K♣ paired with 9♠/9♥/9♦ | 9 | 80% each | 7.2 |
| Missed clubs | A♣J♣, A♣T♣, and 10 other combos; exact list below | 12 | 10%–80% | 4.8 |
| Total with A♥Q♥ | 27 | — | 18.0 | |
The 12 missed clubs and their bet frequencies are: A♣J♣ 80%, A♣T♣ 70%, Q♣J♣ 60%, Q♣T♣ 50%, J♣T♣ 45%, J♣8♣ 40%, T♣8♣ 35%, 8♣6♣ 30%, 6♣5♣ 25%, 5♣3♣ 20%, J♣6♣ 15%, and T♣6♣ 10%. The 4♣ turn gives each two-club hand a flush draw; the 2♠ river misses it. They also make no pair or straight.
The made-hand bet mass is 3×1 + 3×1 + 9×0.8 = 13.2. The missed-draw frequencies sum to 4.8. Bet mass is measured in weighted combos; it need not be an integer.
Case 1: A♥Q♥ changes 44.44% into 26.67%
A♥Q♥ conflicts with none of the 27 combinations. Before the action, 12 of 27 legal combos are missed draws, so their prior share is 44.44%. But the observed bet is more likely under the made-hand part of our model:
Made-hand bet mass = 13.2
Missed-draw bet mass = 4.8
Total bet mass = 18.0
Posterior missed-draw share = 4.8 / 18 = 26.67%
For one concrete row, A♣J♣ starts with weight 1 and bets 80%, so its unnormalized after-bet weight is 0.8. T♣6♣ starts with the same weight but bets 10%, so its after-bet weight is 0.1. Keeping both because they “can bet” and assigning each one vote discards most of the information in the frequency column.
Three denominators that answer different questions
- 12/27 is the missed-draw share before seeing the bet.
- 4.8/18 is the missed-draw share after seeing the bet under the declared frequencies.
- 18/27 = 66.67% is how often the whole declared range bets, because all prior weights happen to equal 1.
Mixing these denominators is the core spreadsheet error. The posterior category share divides that category’s action mass by the action mass of the whole legal range.
Turn the posterior into pot-sized call EV
The pot is 100 before Villain bets 100. Hero must call 100. Measured from the decision point, a win nets 200 chips—the old pot plus Villain’s bet—while a loss costs 100. If q is the posterior probability of a missed draw, then:
Call EV = q×200 − (1−q)×100 = 300q − 100
Break-even q = 100 / 300 = 33.33%
Using the correct posterior, q = 4/15, so the call EV is 300×4/15 − 100 = −20 chips. Equal-count filtering incorrectly keeps q = 12/27 = 4/9 and reports +33.33. The wrong denominator changes the decision sign in this fixture.
This is incremental chip EV for the river choice only. It is not total-hand EV, a rake-inclusive result, a money forecast, or advice about an undeclared opponent. Fold is the zero baseline at the decision point.
Case 2: A♣Q♣ removes four missed draws first
Known cards are evidence before the bet-frequency update. With A♣Q♣, Villain cannot hold A♣J♣, A♣T♣, Q♣J♣, or Q♣T♣. Those four hands have combined bet mass 0.8+0.7+0.6+0.5 = 2.6. The made-hand side is unchanged.
Legal prior = 15 made hands + 8 missed draws = 23 combos
Missed-draw bet mass = 4.8 − 2.6 = 2.2
Total bet mass = 13.2 + 2.2 = 15.4
Posterior missed-draw share = 2.2 / 15.4 = 1/7 = 14.29%
Call EV = 300×1/7 − 100 = −57.14 chips
The naive method again gets the sign wrong: 8/23 = 34.78%, just above the 33.33% break-even threshold, for a reported +4.35 chips. Exact suits matter because blockers remove physical combinations, not abstract hand labels. See our combo-counting guide for the underlying card arithmetic.
A repeatable range-update workflow
- Name the conditioning point. “Range on the river before a bet” is different from “range after the bet.” Record the board, action path, positions, sizes, stacks, and rake model that define that point.
- Work with exact combos. Remove every hand that shares a board card or a known hole card. A class such as A♣x♣ is not one combo.
- Preserve reach weights. If a hand reached the node at weight 0.4, start at 0.4—not one. For a path with several decisions, multiply by every relevant action frequency along the path.
- Apply the observed-action likelihood. Multiply each surviving weight by the frequency of the action actually observed. A zero frequency removes the combo; a small positive frequency keeps only a small mass.
- Normalize and aggregate. Divide by total surviving action mass, then sum posterior weights by the category relevant to your question. Only then combine that probability with pot odds or another payoff model.
For example, after check–raise, a combo’s path mass is its starting weight × check frequency × raise frequency at the later node. This is precisely why an after-action range is not reconstructed by looking at the final raise column alone.
Where the simple formula stops
The output is conditional on the input model. If the action frequencies are guesses, the posterior is a transparent transformation of those guesses—not discovered truth. One observed showdown cannot reliably estimate a population’s frequencies by itself. Solver frequencies are specific to their ranges, action tree, sizes, stacks, rake, and abstraction.
Our Hero is one exact hand, so a binary card-compatibility filter is enough. If Hero is itself a weighted range, the real frequency of Villain’s hands also depends on compatible Hero matchup mass. PioSOLVER calls out that distinction between combo frequency and real frequency. Our separate range-vs-range equity audit shows how joint card removal changes aggregation.
This example is heads-up and ends on the river. It excludes correlated multiway ranges, folded-card information, future runouts, rake, tournament payouts, side pots, and ties. Add those only with a model that defines them; do not silently treat them as zero.
Use solver output without inventing capabilities
According to the current U.S. App Store listing, GTO Gecko can be used to review available actions, mixed-strategy frequencies, EV estimates, range composition, hand combos, and the action path in precomputed spots available to a plan. The listing says these features require a paid plan and that available libraries depend on the plan. The 27-combo fixture here is an article-specific teaching model; it is not an app output, and this article does not claim that the app provides an arbitrary posterior calculator or this custom node.
A useful study note records both the source and the boundary: “At this solved node, copied exact hand weights and bet frequencies; conditioned on my exact cards; no claim that one opponent follows those frequencies.” That makes a range update reproducible without turning a model into a read.
Method, downloads, and separate implementation check
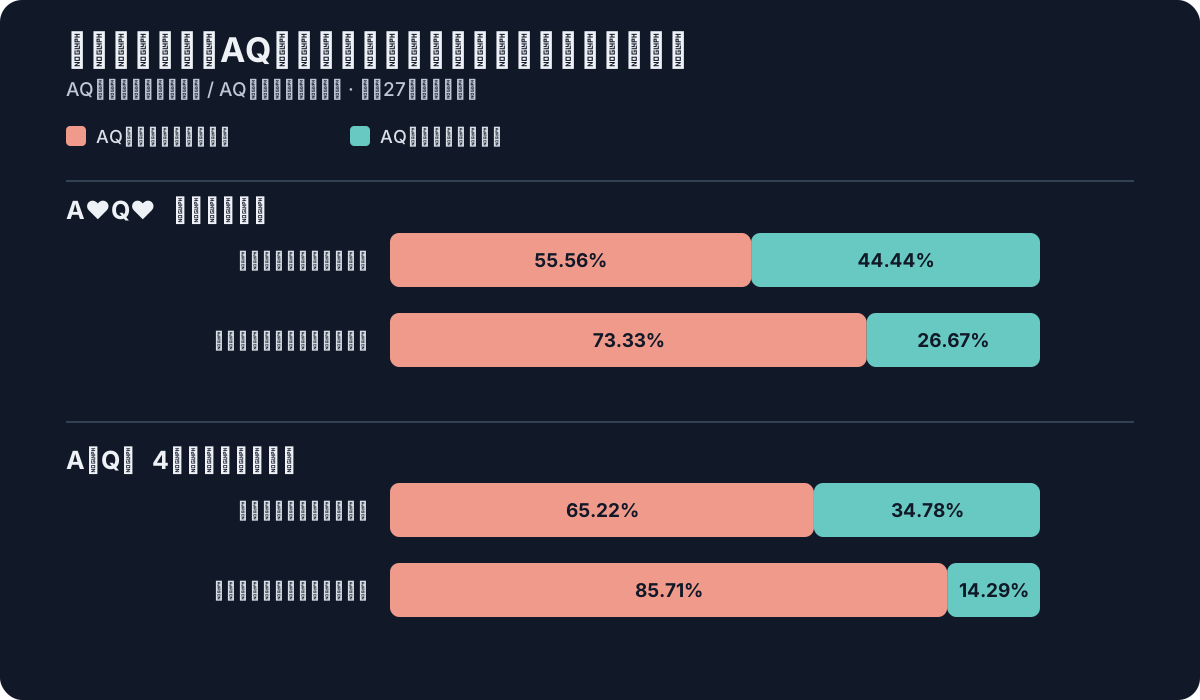
The public evidence bundle includes the 54-row combo ledger (27 candidates for each Hero hand), case summary, full JSON model, English SVG, Japanese SVG, deterministic generator, separate Python verifier, reproduction instructions, and SHA-256 manifest.
The verifier reconstructs card legality and all action masses from a separate compact fixture, checks both EV paths, validates every normalized row, and then verifies release hashes. There is no random seed or sampled result. Run node generate.mjs, then python verify.py; optimized Python mode runs the same explicit checks.
Frequently asked questions
- Does a bet always make a range stronger?
- No. It shifts the range toward whatever hands bet more often in the declared model. Our made hands bet more often than our missed draws, so the posterior becomes stronger. Another frequency table could move it the other way.
- Should a hand with a 10% bet frequency stay in the range?
- Yes, with one tenth of its incoming weight after observing the bet. “Present” is not the same as “equally likely.”
- Is the posterior bluff share the same as equity?
- Only in this deliberately binary river fixture, where Hero beats every listed missed draw, loses to every made hand, and never ties. In ordinary ranges, calculate showdown equity for each compatible matchup instead.
Sources
- PioSOLVER: calculation, strategies and other concepts — starting range multiplied by the strategies along an action path; action-frequency and matchup weighting. Accessed September 14, 2026.
- PioSOLVER: meaning of numbers — range weights, action ranges, card removal, and real frequency. Accessed September 14, 2026.
- MIT OpenCourseWare 18.05: conditional probability and Bayes’ theorem — independent probability reference. Accessed September 14, 2026.
- PokerStars: Texas Hold’em rules — standard 52-card, hole-card, board, river, and best-five framework. Accessed September 14, 2026.